These are the directions for the project: This lab explores objects moving with either a constant velocity or a constant acceleration and involves the use
These are the directions for the project:
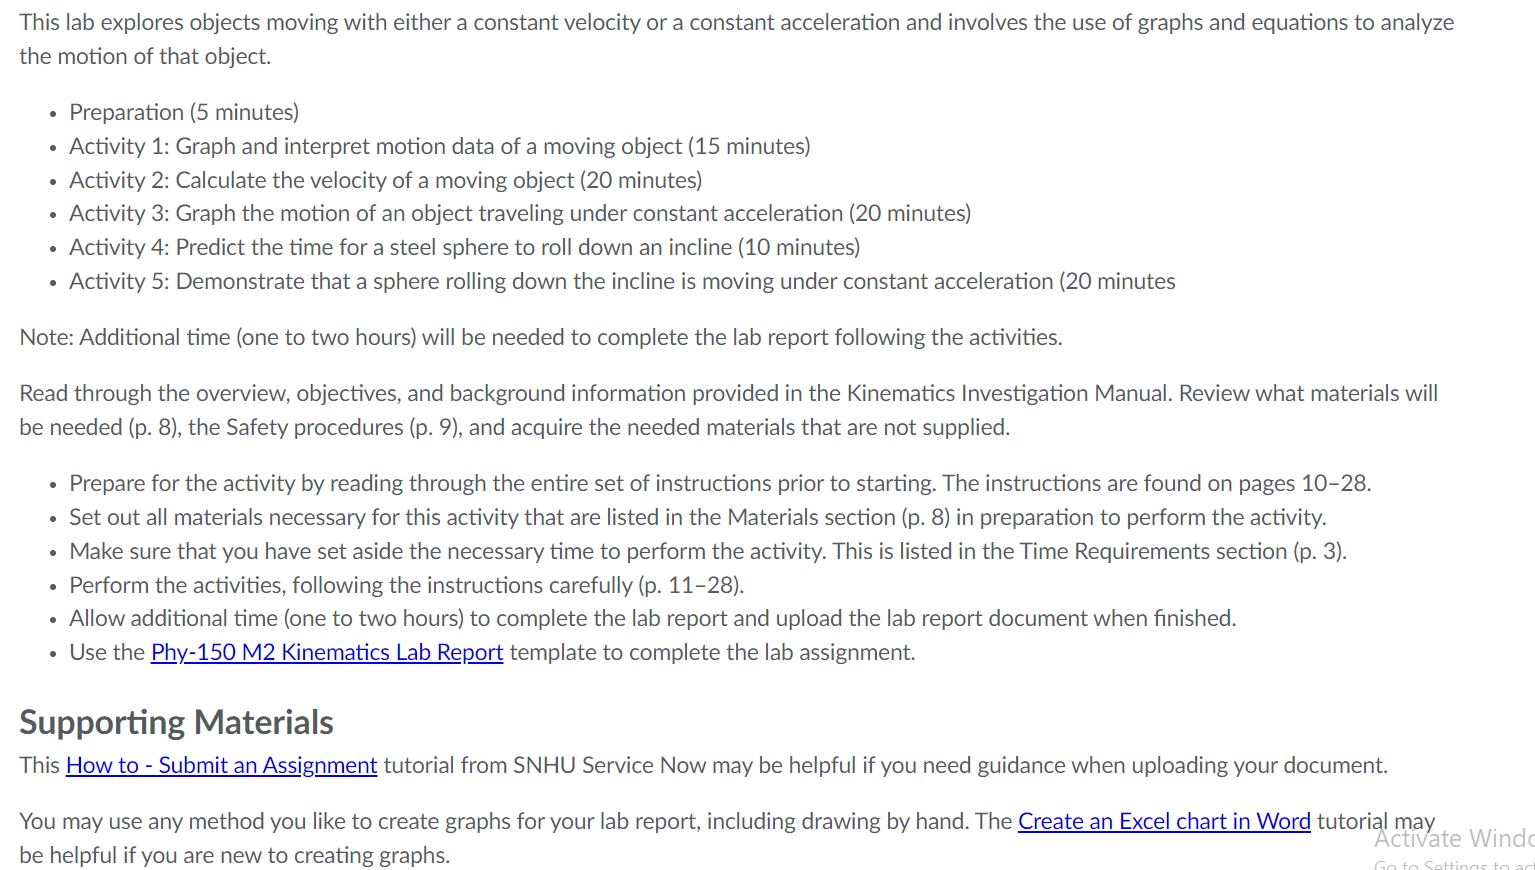
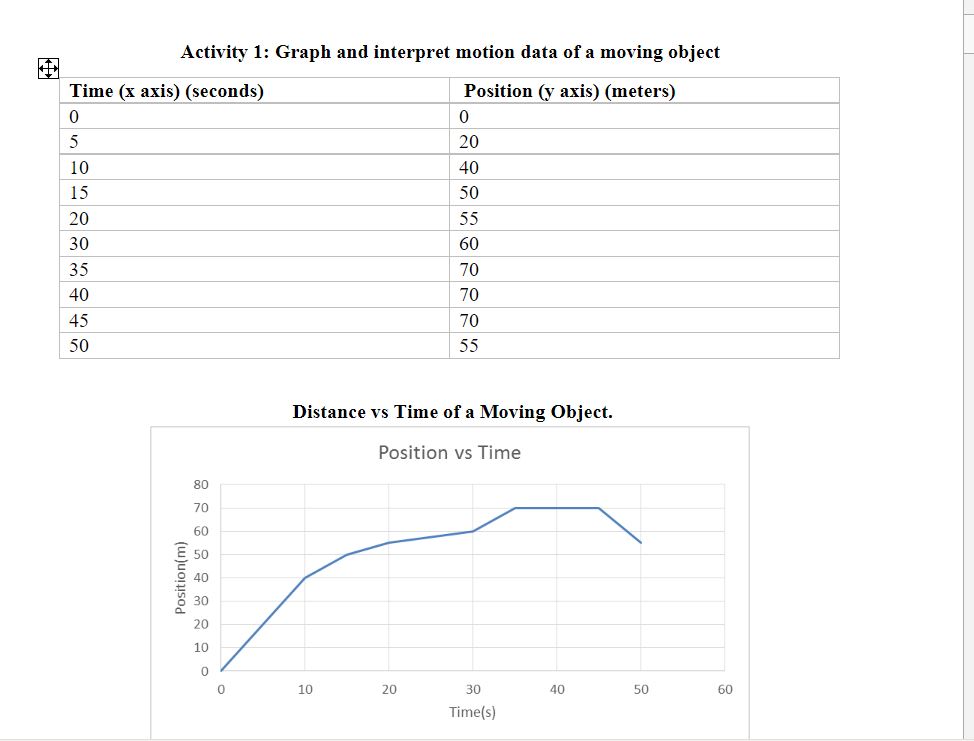
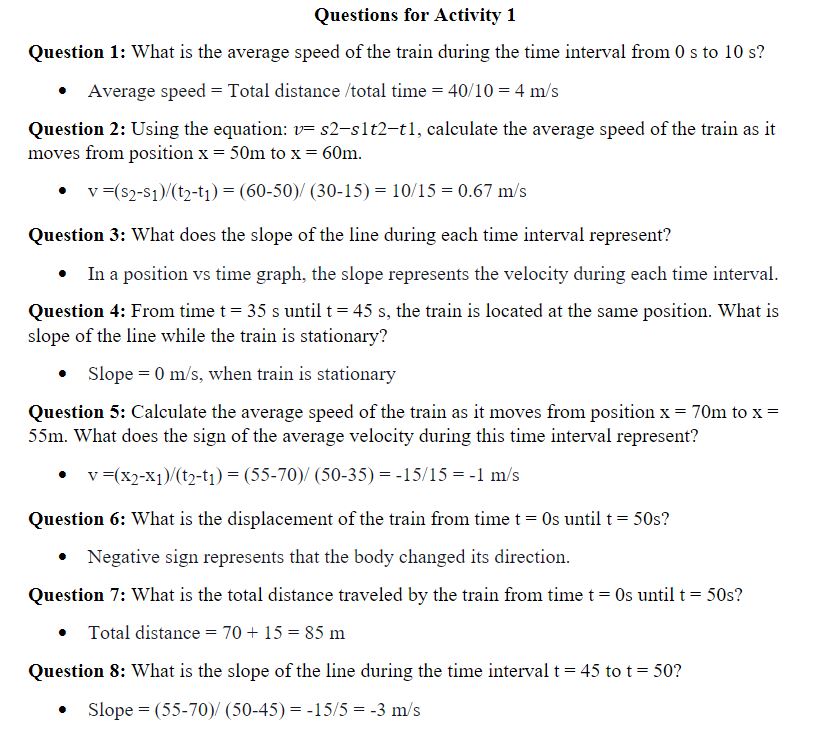
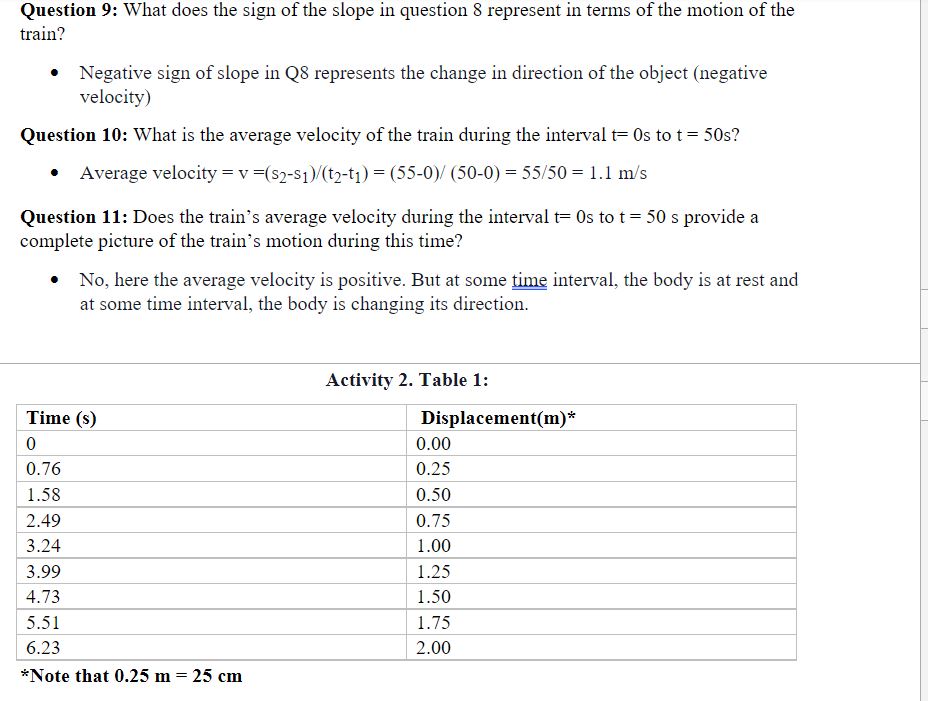
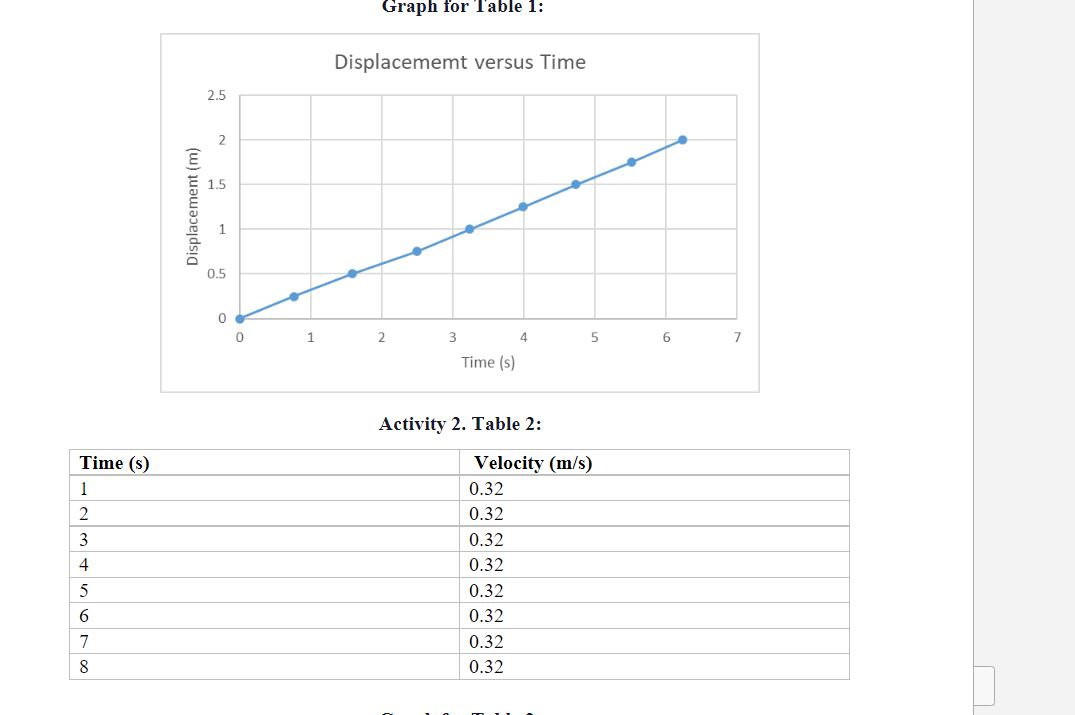
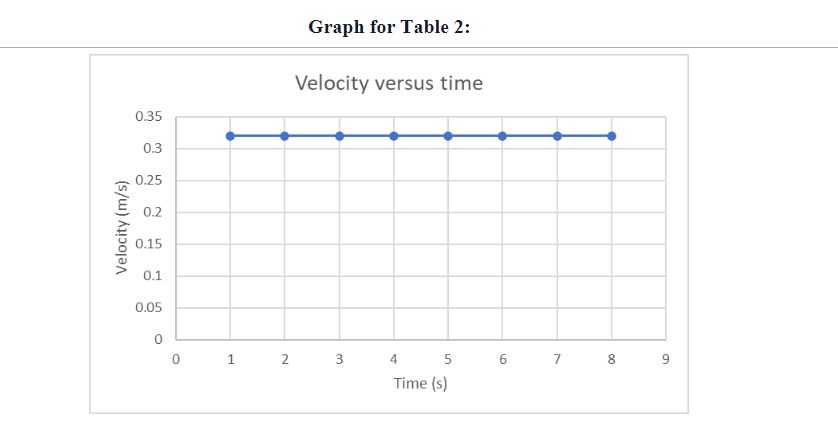
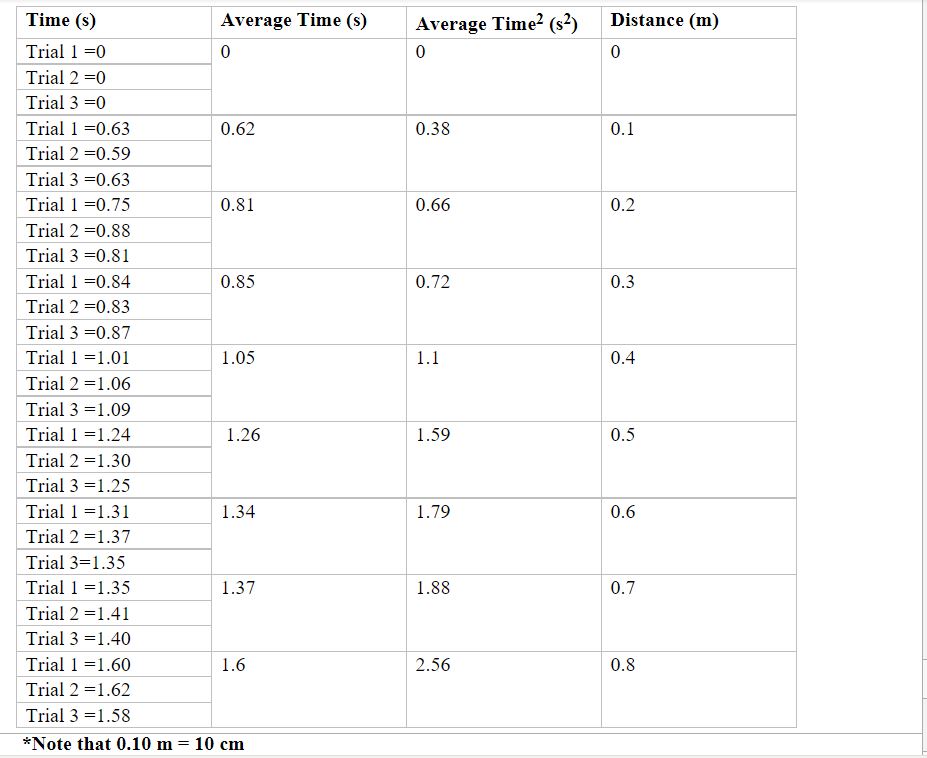
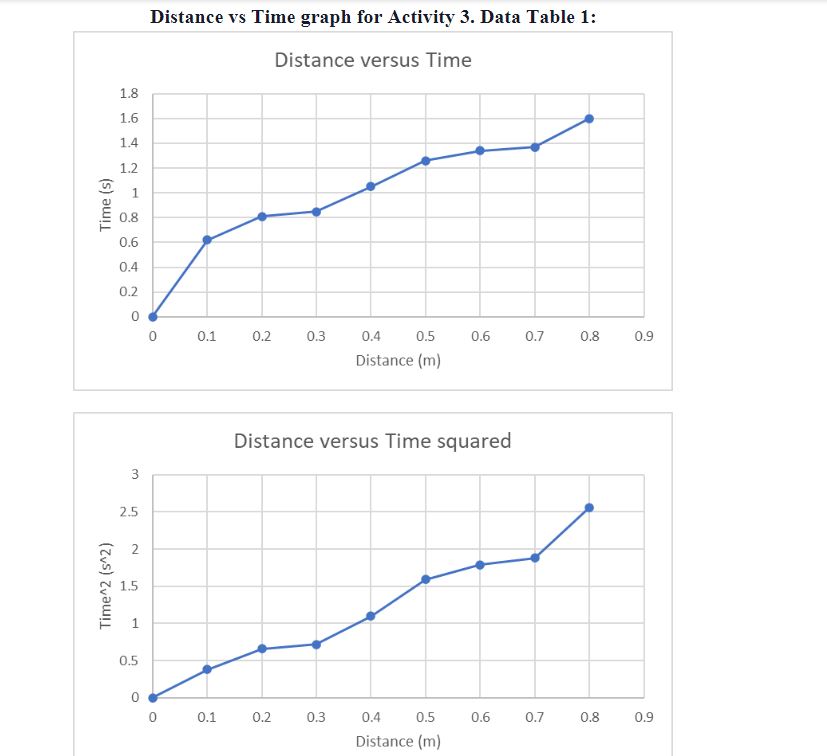
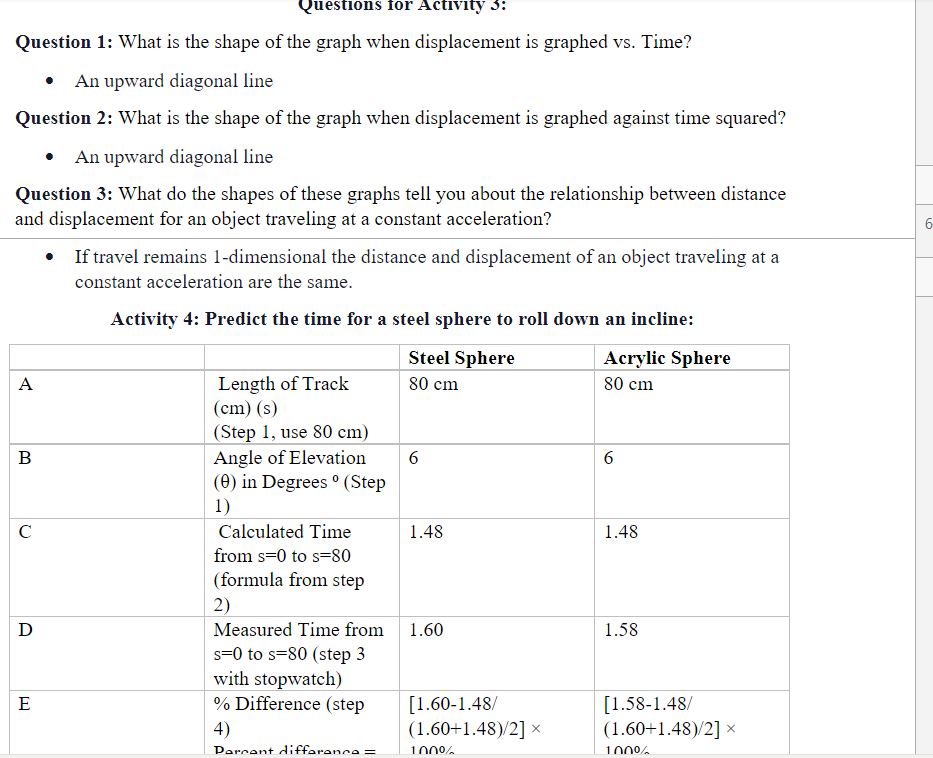
This lab explores objects moving with either a constant velocity or a constant acceleration and involves the use of graphs and equations to analyze the motion of that object. - Preparation (5 minutes) Activity 1: Graph and interpret motion data of a moving object (15 minutes} Activity 2: Calculate the velocity of a moving object (20 minutes) Activity 3: Graph the motion of an object traveling under constant acceleration (20 minutes) Activity 4: Predict the time for a steel sphere to roll down an incline (10 minutes) Activity 5: Demonstrate that a sphere rolling down the incline is moving under constant acceleration (20 minutes Note: Additional time (one to two hours} will be needed to complete the lab report following the activities. Read through the overview, objectives, and background information provided in the Kinematics Investigation Manual. Review what materials will be needed (p. 8). the Safety procedures (p. 9), and acquire the needed materials that are not supplied. Prepare for the activity by reading through the entire set of instructions prior to starting. The instructions are found on pages 10-28. Set out all materials necessary for this activity that are listed in the Materials section (p. 8) in preparation to perform the activity. Make sure that you have set aside the necessary time to perform the activity. This is listed in the Time Requirements section (p. 3). Perform the activities, following the instructions carefully (p. 1128). Allow additional time (one to two hours) to complete the lab report and upload the lab report document when nished. Use the P_hy-150 M2 Kinematics Lab Repo_rt template to complete the lab assignment. Supporting Materials This How to - Submit an Assignment tutorial from SNHU Service Now may be helpful if you need guidance when uploading your document. You may use any method you like to create graphs for your lab report, including drawing by hand. The Create an Excel chart in Word tutorial may _ be helpful if you are new to creating graphs. I ' \fQuestions for Activity 1 Question 1: 'What is the average speed of the train during the time interval from 0 s to 10 s? 0 Average speed = Total distance ..-"total time = 40:"10 = 4 m-"s Question 2: Using the equation: v= s2-sl t2-tl . calculate the average speed of the train as it moves from position X = 50m to x = 60m. 0 v =(52-sll.-"(t2T1l = (6050}? {30-15) = [CL-"15 = 0.6?111-"5 Question 3: "What does the slope of the line during each time interval represent? 0 In a position vs time graph. the slope represents the velocity during each time interval. Question 4: From time t = 35 s until t= 45 s. the train is located at the same position. What is slope of the line while the train is stationary? 0 Slope = O m-"s, when train is stationaryr Question 5: Calculate the average speed of the train as it moves from position x = "film to X = 55m. \"That does the sign of the average velocity during this tnne interval represent? . v =(X3X1)..-'{t3-t1} = {SE7'0)! {5035) = 45:15 = -l m-"s Question 6: "What is the displacement of the train from time t = Us until t= 505? 0 Negative sign represents that the body changed its direction. Question 7": "What is the total distance traveled by the train from time t= Us until t = 505? 0 Total distance = TO + 15 = 85 in Question 8: "What is the slope of the line during the time interval t = 45 to t = 50? 0 Slope = {SSTU)! (5045) = 15_-"5 = 3 111-"s Question 9: What does the sign of the slope in question 8 represent in terms of the motion of the train? 0 Negative sign of slope in Q8 represents the change in direction of the object (negative velocity] Question 10: 'What is the average velocity of the train during the interval t= Us to t = 505'? 0 Average velocity = v ={5351)-"{t3t1 } = {550).-" {500} = 55:"50 = 1.1 m-"s Question 11: Does the train's average velocity during the interval 1: Us to t = 50 s provide a complete picture of the train's motion during this time? 0 No. here the average velocity is positive. But at some time interval. the body is at rest and at some time interval. the body is changing its direction. Activity 2. Table 1: Time (s) _ Displacement(m)* 0 0.00 0.?6 _ 0.25 1.58 0.50 2.49 _ 0.25 3.24 1.00 3.99 1.25 4.?3 1.50 5.51 _ 1.25 6.23 2.00 *Note that 0.25 In = 25 cm \fGraph for Table 2: Velocity versus time 0.35 0.3 0.25 Velocity (m/s) 0.15 0.1 0.05 0 5 6 7 8 9 0 1 2 3 4 Time (s)Time (5) Trial 1 =0 Trial 2 =0 Trial 3 =0 Trial 1 =0.63 Trial 2 =0.59 Trial 3 =0.63 Trial 1 =0.?5 Trial 2 =0.88 Trial 3 =0.81 Trial 1 =0.84 Trial 2 =0.83 Trial 3 =08? Trial 1 =1.01 Trial 2 =1.06 Trial 3 =1.09 Trial 1 =1.24 Trial 2 =1.30 Trial 3 =1.25 Trial 1 =1.31 Trial 2 =1.37' Trial 3=1.35 Trial 1 =1.35 Trial 2 =1.41 Trial 3 =1.40 Trial 1 =1.60 Trial 2 =1.62 Trial 3 =1.58 Average Time (s) 0 0.62 0.81 0.85 1.05 1.26 1.34 1.6 *Note that 0.10 m = 10 cm Average Time2 (52) 0.66 0.72 1.1 1.59 1.?9 1.88 2.56 Distance {111) 0 0.1 0.4 0.5 0.6 0.7 0.8 Distance vs Time graph for Activity 3. Data Table 1: Distance versus Time 1.3 Time {s} 0 0.1 0.2 0.3 0.4 0.5 0.6 0.7 0.8 0.9 Distance (mi Distance versus Time squared Time'Z {5&2} 0 0.1 0.2 0.3 (M 0.5 0.6 0.? 0.8 0.9 Distance (mi questions Ior Activity .3: Question 1: What is the shape of the graph when displacement is graphed vs. Time'? 0 An upward diagonal line Question 2: "What is the shape of the graph when displacement is graphed against time squared\"? 0 An upward diagonal line Question 3: What do the shapes of these graphs tell you about the relationship between distance and displacement for an object traveling at a constant acceleration? 0 If travel remains ldimensional the distance and displacement ofan object traveling at a constant acceleration are the same. Activity 4: Predict the time for a steel sphere to roll down an incline: Steel Sphere Acrylic Sphere A Length of Track 80 cm 80 cm {cm} { 5} {Step 1. use 80 cm]I B Angle of Elevation 6 6 {8} in Degrees 0 {Step 1} C Calculated Time 1.48 1.48 from s=0 to s=80 {formula from step 2} D Measured Time from 1.61::I 1.58 s=0 to s=80 {step 3 with stopwatch] _ E % Difference {step [1.601.48f [LES1.43;" 4} {1.60-1.48}..-"2] X {1.60-1.48}.:"3] >
Step by Step Solution
There are 3 Steps involved in it
Step: 1
Get Instant Access to Expert-Tailored Solutions
See step-by-step solutions with expert insights and AI powered tools for academic success
Step: 2
Step: 3
Ace Your Homework with AI
Get the answers you need in no time with our AI-driven, step-by-step assistance