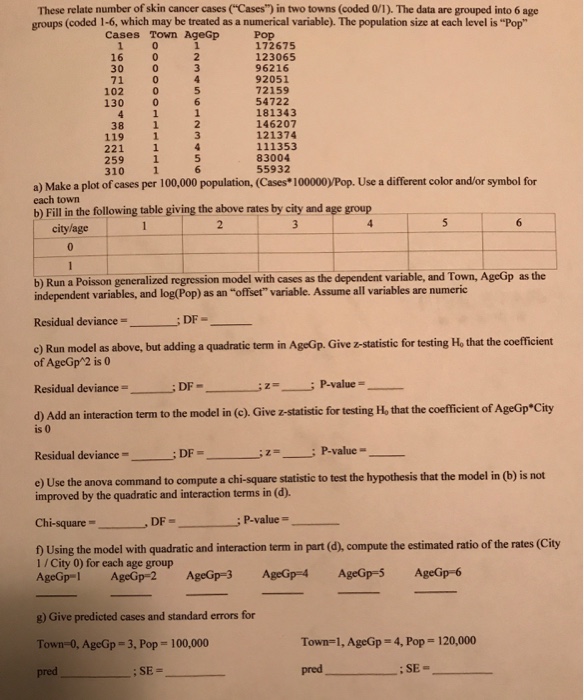
These relate number of skin cancer cases ("Cases") in two towns (coded 0/1). The data are grouped into 6 age groups (coded 1-6, which may be treated as a numerical variable). The population size at each level is "Pop" Cases Town AgeGp 172675 123065 96216 92051 72159 54722 181343 146207 121374 111353 83004 55932 16 30 71 102 130 0 38 119 221 259 310 6 a) Make a plot of cases per 100,000 population, (Cases*100000yPop. Use a different color and/or symbol for each town b) Fill in the following table giving the above rates by city and age group citylage b) Run a Poisson generalized regression model with cases as the dependent variable, and Town, AgeGp as the independent variables, and log(Pop) as an "offse" variable. Assume all variables are numeric Residual deviance = ; DF- c) Run model as above, but adding a quadratic term in AgeGp. Give z-statistic for testing Ho that the coefficient of AgeGp 2 is 0 Residual deviance = ; DF- z= ; P-value = d) Add an interaction term to the model in (c). Give z-statistic for testing Ho that the coefficient of AgeGp City is 0 ; z = : P-value- Residual deviance = DF - e) Use the anova command to compute a chi-square statistic to test the hypothesis that the model in (b) is not improved by the quadratic and interaction terms in (d). Chi-square = , DF = P-value = 0 Using the model with quadratic and interaction term in part (d), compute the estimated ratio of the rates (City 1 / City 0) for each age group AgeGp-1 AgeGp-2 AgeGp-3 AgeGp-4 AgeGp- AgeGp-6 g) Give predicted cases and standard errors for Town-0. AgeGp = 3, Pop = 100,000 Town!, AgeGp = 4, Pope 120,000 These relate number of skin cancer cases ("Cases") in two towns (coded 0/1). The data are grouped into 6 age groups (coded 1-6, which may be treated as a numerical variable). The population size at each level is "Pop" Cases Town AgeGp 172675 123065 96216 92051 72159 54722 181343 146207 121374 111353 83004 55932 16 30 71 102 130 0 38 119 221 259 310 6 a) Make a plot of cases per 100,000 population, (Cases*100000yPop. Use a different color and/or symbol for each town b) Fill in the following table giving the above rates by city and age group citylage b) Run a Poisson generalized regression model with cases as the dependent variable, and Town, AgeGp as the independent variables, and log(Pop) as an "offse" variable. Assume all variables are numeric Residual deviance = ; DF- c) Run model as above, but adding a quadratic term in AgeGp. Give z-statistic for testing Ho that the coefficient of AgeGp 2 is 0 Residual deviance = ; DF- z= ; P-value = d) Add an interaction term to the model in (c). Give z-statistic for testing Ho that the coefficient of AgeGp City is 0 ; z = : P-value- Residual deviance = DF - e) Use the anova command to compute a chi-square statistic to test the hypothesis that the model in (b) is not improved by the quadratic and interaction terms in (d). Chi-square = , DF = P-value = 0 Using the model with quadratic and interaction term in part (d), compute the estimated ratio of the rates (City 1 / City 0) for each age group AgeGp-1 AgeGp-2 AgeGp-3 AgeGp-4 AgeGp- AgeGp-6 g) Give predicted cases and standard errors for Town-0. AgeGp = 3, Pop = 100,000 Town!, AgeGp = 4, Pope 120,000


