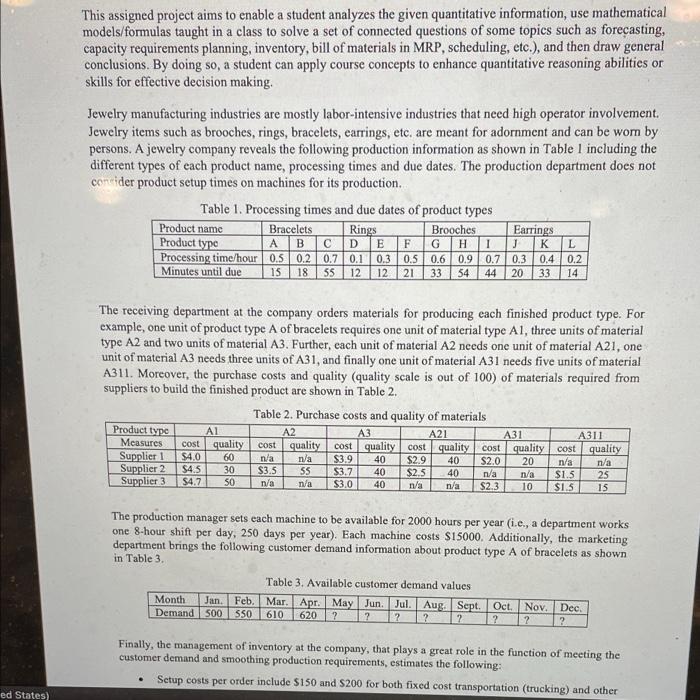
This assigned project aims to enable a student analyzes the given quantitative information, use mathematical models/formulas taught in a class to solve a set of connected questions of some topics such as forecasting, capacity requirements planning, inventory, bill of materials in MRP, scheduling, etc.), and then draw general conclusions. By doing so, a student can apply course concepts to enhance quantitative reasoning abilities or skills for effective decision making. Jewelry manufacturing industries are mostly labor-intensive industries that need high operator involvement. Jewelry items such as brooches, rings, bracelets, earrings, etc. are meant for adornment and can be worn by persons. A jewelry company reveals the following production information as shown in Table 1 including the different types of each product name, processing times and due dates. The production department does not consider product setup times on machines for its production. Table 1. Processing times and due dates of product types Product name Bracelets Rings Brooches Earrings Product type Processing time/hour 0.5 0.2 0.7 0.1 0.3 0.5 0.6 0.9 0.7 0.3 0.4 Minutes until due 1855 12 12 2133 B D E F G H 1 J K L 02 14 1S 54 44 20 33 The receiving department at the company orders materials for producing each finished product type. For example, one unit of product type A of bracelets requires onc unit of material type A1, three units of material type A2 and two units of material A3. Further, cach unit of material A2 needs one unit of material A21, one unit of material A3 needs three units of A31, and finally one unit of material A31 needs five units of material A311. Moreover, the purchase costs and quality (quality scale is out of 100) of materials required from suppliers to build the finished product are shown in Table 2. Table 2. Purchase costs and quality of materials Product type A3 A21 A311 Measures quality cost quality cost quality cost quality cost quality cost quality Supplier 1 $40 $2.9 Supplier 2 $2.5 Supplier 3 $4.7 $3.0 A1 A2 A31 cost $4.5 60 30 SO n/a $3.5 n/a n/a SS n/a $3.9 $3.7 40 40 40 888 40 40 n/a $2.0 n/a $2.3 20 n/a 10 n/a $1.5 $1.5 n/a 25 15 n/a The production manager sets each machine to be available for 2000 hours per year (i.e., a department works one 8-hour shift per day, 250 days per year). Each machine costs $15000. Additionally, the marketing department brings the following customer demand information about product type A of bracelets as shown in Table 3. Month Jan Feb. Demand 500 SSO Table 3. Available customer demand values Mar. Apr. May Jun. Aug. Sept. Oct Nov Dec. 610 620 ? ? ? ? ? ? 2 ? Jul Finally, the management of inventory at the company, that plays a great role in the function of meeting the customer demand and smoothing production requirements, estimates the following: Setup costs per order include $150 and $200 for both fixed cost transportation (trucking) and other ed States) 13. Develop a simple linear programming model including decision variables, constraints, and objective function if you want to minimize the cost of the ending inventory of product type A. Assume that the management does not want to produce more than 650 units every month. The ending inventory of a month equals the starting inventory plus the produced unit minus the demand of each period. Make sure you consider that the staring inventory of the current month is the ending inventory of the previous month. (Due April 10, 2022, by midnight) BONUS


