

Question
This assignment is complete. First posted is the instructions then below it is my report. I need this Proof read to see if I made
This assignment is complete. First posted is the instructions then below it is my report. I need this Proof read to see if I made any mistakes or if I can improve on any area. This is my final class before I graduate and I need as much help with math as I can get.
Curve-fitting Project -Linear Model (due at the end of Week 5)
Instructions
For this assignment, collect data exhibiting a relatively linear trend, find the line of best fit, plot the data and the line, interpret the slope, and use the linear equation to make a prediction. Also, findr2(coefficient of determination) andr(correlation coefficient). Discuss your findings. Your topic may be that is related to sports, health, the economy, or something you find interesting. Ifis strongly recommended that you take advantage of the data search tools provided. Appropriate technology must be used for plots/graphs and determination of the equation of the line and the correlation.
A completeLinear Model ExampleandTechnology Tips are provided in separate documents. Information on some data search tools is also provided.
Tasks for Linear Regression Model (LR)
(LR-1)Describe yourtopic, provide yourdata, and cite yoursource.Collect at least 8 data points. An acceptable data set must exhibit a relatively linear pattern. Label appropriately. Each student must use different data.
REQUIRED: Participation in the Linear Model Project Discussion, counting toward your participation grade. In the discussion, your post must include (A) a brief title, (B) informative description of your topic, with x and y variables defined, (C) table of data and a reference for its source, and (D) a rough sketch of the scatterplot,and a of your posting, by the end of Week 4, February 4.(In the completed project, the topic, data set, source should also be included, and the scatterplot must be generated by technology.)
The idea with the discussion posting is two-fold: (1) To share your interesting project idea with your classmates, and (2) To give me a chance to give you a brief thumbs-up or thumbs-down about your proposed topic and data. Sometimes students get off on the wrong foot or misunderstand the intent of the project, or are unsure whether a particular data set is suitable, and your posting provides an opportunity for some feedback. Projects with inappropriate data sets for linear models receive poor grades.
Remark:Students may choose similar topics, but must examinedifferent data sets. For example, several students may be interested in a particular Olympic sport, and that is fine, but they must collect different data, perhaps from different events or different gender.
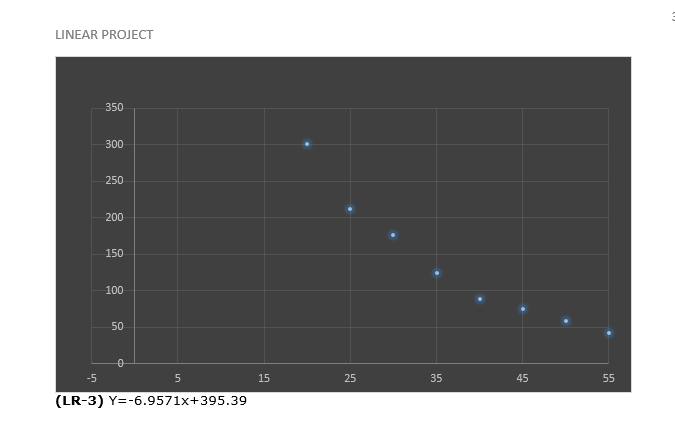
(LR-2) Using technology, plot the points (x,y) to obtain ascatterplot. Use an appropriate scale on the horizontal and vertical axes and be sure to label carefully.Visually judge whether the data points exhibit a relatively linear trend. (If so, proceed. If not, try a different topic or data set.)
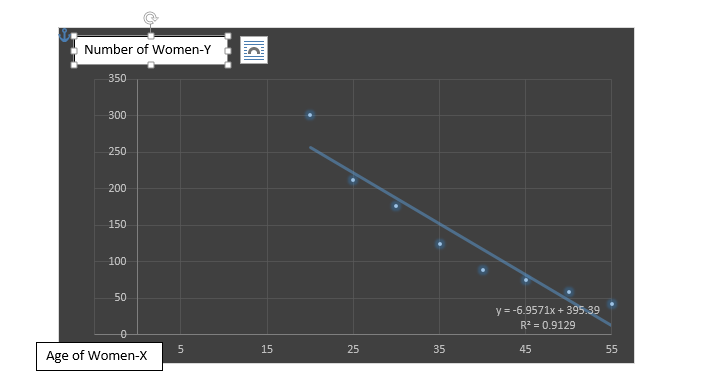
(LR-3) Using technology, find theline of best fit(regression line) andgraphit on the scatterplot.State theequationof the line.
(LR-4)State theslopeof the line of best fit. Carefullyinterpretthe meaning of the slope in a sentence or two.
(LR-5)Find and state the value ofr2, the coefficient of determination, andr, the correlation coefficient. Discuss your findings in a few sentences. Isrpositive or negative? Why? Is a line a good curve to fit to this data? Why or why not? Is the linear relationship very strong, moderately strong, weak, or nonexistent?
(LR-6)Choose a value of interest and use the line of best fit to make anestimate or prediction. Show calculation work.
(LR-7)Write a briefnarrativeof a paragraph or two. Summarize your findings and be sure to mention any aspect of the linear model project (topic, data, scatterplot, line,r, or estimate, etc.) that you found particularly important or interesting.
You may submit all of your project in one document or a combination of documents, which may consist of word processing documents or spreadsheets, provided it is clearly labeled where each task can be found. Be sure to include your name. Projects are graded on the basis of completeness, correctness, ease in locating all of the checklist items, and strength of the narrative portions.
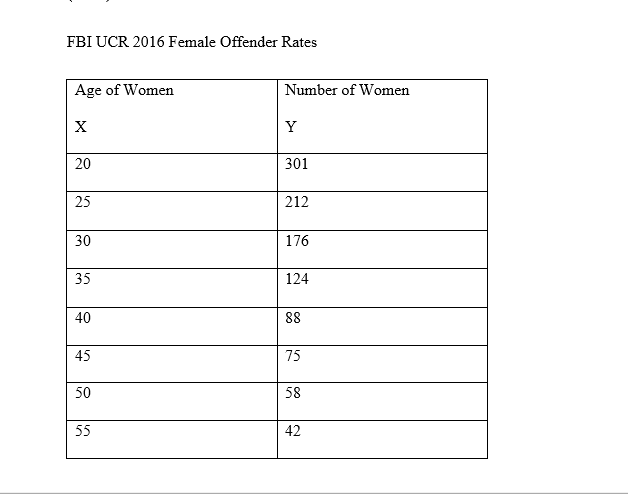
(LR-1)My data will be female murder rates compared to age in the year 2016. This information is gathered from UCR (Unified Crime Report) listed on the FBI site (https://ucr.fbi.gov/crime-in-the-u.s/2016/crime-in-the-u.s.-2016/tables/expanded-homicide-data-table-2.xls).
(LR-2)
FBI UCR 2016 Female Offender Rates
Step by Step Solution
There are 3 Steps involved in it
Step: 1

Get Instant Access to Expert-Tailored Solutions
See step-by-step solutions with expert insights and AI powered tools for academic success
Step: 2

Step: 3
Ace Your Homework with AI
Get the answers you need in no time with our AI-driven, step-by-step assistance
Get Started
An Introduction to Analysis
Authors: William R. Wade
4th edition
132296381, 978-0132296380