Question
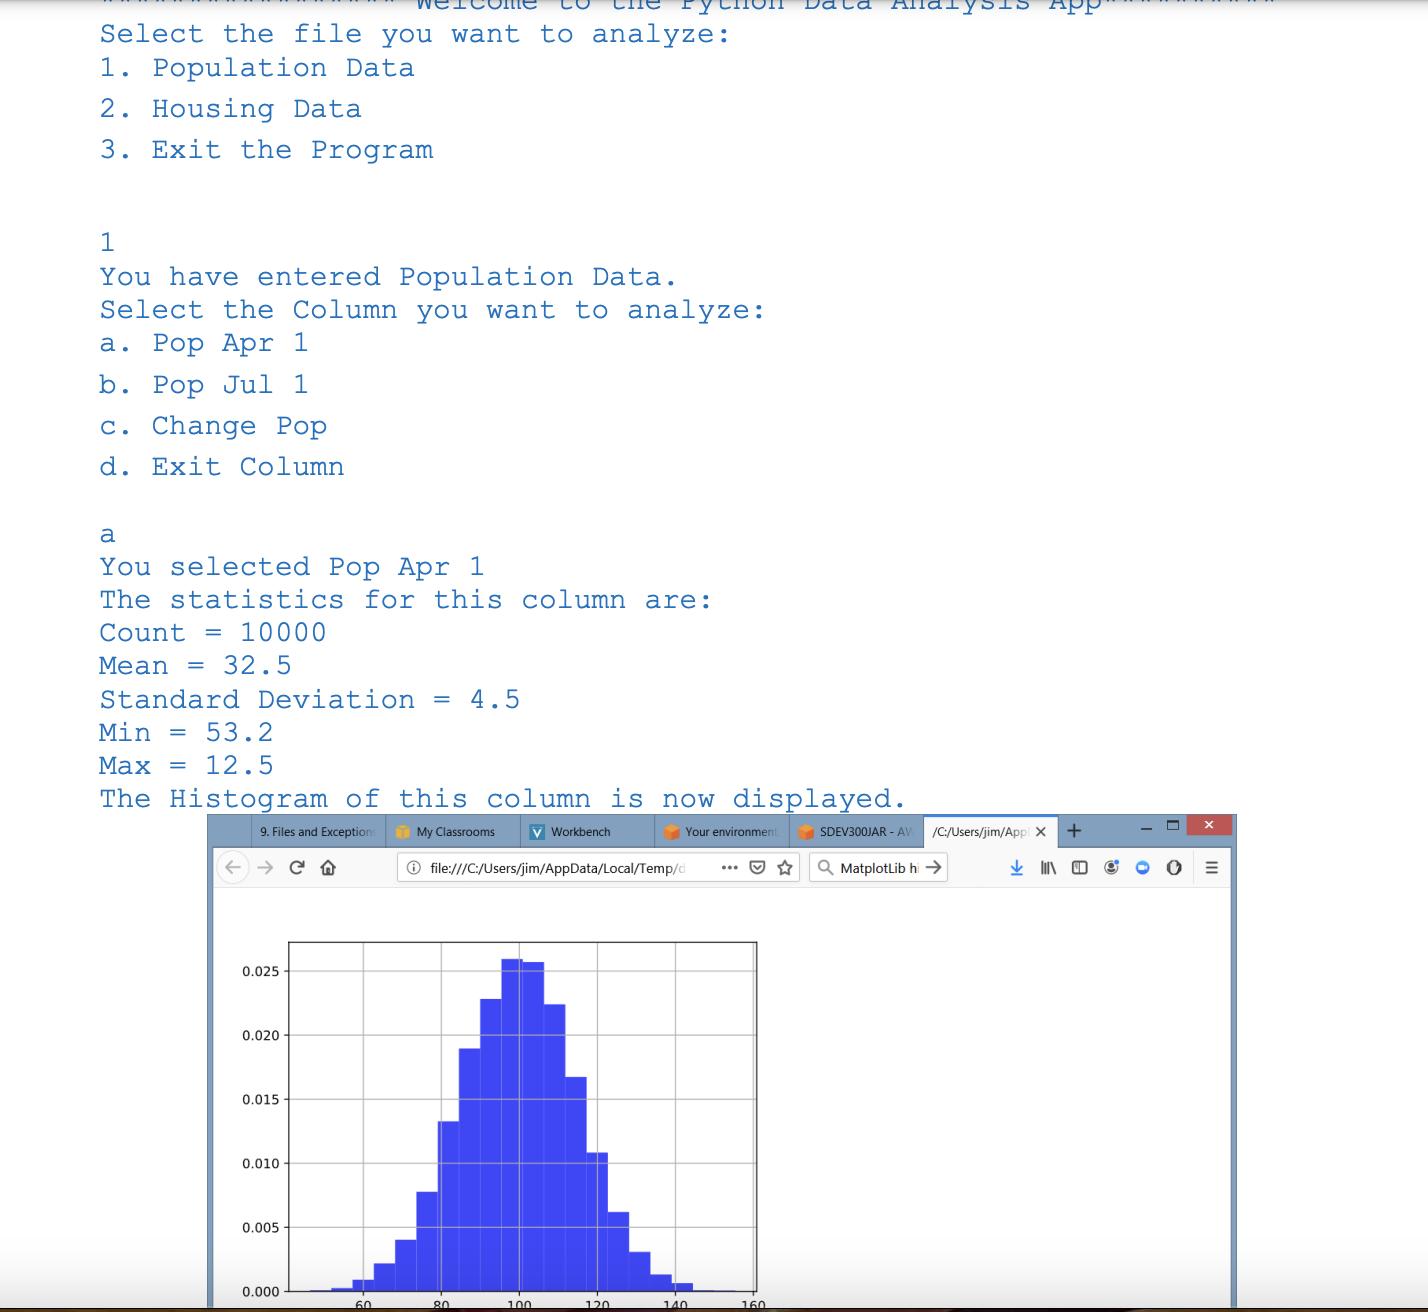
This exercise allows a user to load one of two CSV files and then perform histogram analysis and plots for select variables on the datasets.


house.csv
AGE | BEDRMS | BUILT | NUNITS | ROOMS | WEIGHT | UTILITY |
82 | 2 | 2006 | 1 | 6 | 3117.394239 | 169 |
50 | 4 | 1980 | 1 | 6 | 2150.725544 | 245.3333333 |
53 | 4 | 1985 | 1 | 7 | 2213.789404 | 159 |
67 | 3 | 1985 | 1 | 6 | 2364.585097 | 179 |
26 | 2 | 1980 | 100 | 4 | 2314.524902 | 146 |
56 | 1 | 1985 | 32 | 3 | 2482.655916 | 94.75 |
50 | 3 | 1985 | 1 | 6 | 4084.310118 | 236 |
26 | 2 | 1980 | 8 | 5 | 2823.39599 | 81 |
60 | 3 | 1985 | 1 | 7 | 2552.762241 | 184.0833333 |
26 | 1 | 1985 | 24 | 3 | 2845.454432 | 0 |
59 | 3 | 1985 | 1 | 5 | 2150.592362 | 172 |
54 | 5 | 2005 | 1 | 9 | 2791.995108 | 467.5833333 |
25 | 2 | 2009 | 12 | 4 | 1934.565082 | 135 |
53 | 3 | 2007 | 1 | 7 | 2840.95499 | 152.1666667 |
52 | 4 | 2009 | 1 | 9 | 2840.95499 | 364 |
67 | 5 | 1985 | 1 | 9 | 2428.354692 | 469.8333333 |
22 | 2 | 2005 | 8 | 4 | 2524.164373 | 50.08333333 |
55 | 3 | 1980 | 1 | 6 | 2918.327087 | 332.8333333 |
57 | 3 | 1980 | 1 | 9 | 2534.642076 | 245.6666667 |
84 | 2 | 1980 | 1 | 5 | 2226.80362 | 145.1666667 |
55 | 2 | 2004 | 1 | 6 | 2880.506791 | 65 |
74 | 2 | 2003 | 1 | 4 | 3152.342745 | 109 |
67 | 2 | 1990 | 1 | 6 | 3304.581422 | 141.8333333 |
70 | 3 | 1990 | 1 | 7 | 3522.801866 | 282.5 |
59 | 3 | 2005 | 1 | 7 | 2703.395803 | 288.25 |
62 | 2 | 1990 | 1 | 6 | 4007.388181 | 315 |
32 | 4 | 2004 | 1 | 7 | 2807.2076 | 310.8333333 |
-9 | 2 | 1980 | 24 | 5 | 1648.50752 | 0 |
54 | 4 | 2007 | 1 | 10 | 2080.747516 | 317 |
25 | 3 | 2012 | 1 | 6 | 4194.143162 | 184.8333333 |
41 | 3 | 1985 | 1 | 7 | 2023.995536 | 308 |
50 | 3 | 1990 | 1 | 10 | 3570.773875 | 207 |
15 | 2 | 2004 | 1 | 7 | 3736.447401 | 148.6666667 |
54 | 3 | 1980 | 1 | 7 | 2261.445448 | 163 |
24 | 3 | 2007 | 200 | 6 | 5081.703183 | 0 |
28 | 1 | 1990 | 60 | 3 | 3023.669904 | 52 |
24 | 2 | 2007 | 36 | 4 | 5756.60996 | 250.6666667 |
40 | 5 | 2007 | 1 | 9 | 2488.405077 | 301.8333333 |
26 | 3 | 2009 | 1 | 6 | 3266.401361 | 96 |
50 | 3 | 2008 | 1 | 6 | 1983.373313 | 174 |
86 | 1 | 1980 | 105 | 3 | 2045.933536 | 0 |
60 | 4 | 1990 | 1 | 8 | 3321.532218 | 241.1666667 |
39 | 3 | 2006 | 1 | 5 | 2660.859635 | 176.1666667 |
34 | 2 | 1985 | 1 | 4 | 3096.004644 | 33 |
64 | 3 | 1990 | 1 | 6 | 3996.478152 | 234.8333333 |
52 | 3 | 1990 | 1 | 7 | 4410.105187 | 258 |
71 | 3 | 1990 | 1 | 7 | 4946.868585 | 666.75 |
34 | 1 | 1985 | 1 | 3 | 1366.171372 | 0 |
72 | 4 | 1985 | 1 | 8 | 2483.823695 | 154 |
pop change csv
Id | Geography | Target Geo Id | Target Geo Id2 | Pop Apr 1 | Pop Jul 1 | Change Pop |
0100000US | United States | 310M400US10100 | 10100 | 40603 | 43191 | 2588 |
0100000US | United States | 310M400US10140 | 10140 | 72798 | 73901 | 1103 |
0100000US | United States | 310M400US10220 | 10220 | 37490 | 38247 | 757 |
0100000US | United States | 310M400US10300 | 10300 | 99892 | 98266 | -1626 |
0100000US | United States | 310M400US10460 | 10460 | 63832 | 66781 | 2949 |
0100000US | United States | 310M400US10620 | 10620 | 60586 | 62075 | 1489 |
0100000US | United States | 310M400US10660 | 10660 | 31254 | 30444 | -810 |
0100000US | United States | 310M400US10700 | 10700 | 93019 | 96109 | 3090 |
0100000US | United States | 310M400US10760 | 10760 | 41618 | 40497 | -1121 |
0100000US | United States | 310M400US10820 | 10820 | 36009 | 37964 | 1955 |
0100000US | United States | 310M400US10860 | 10860 | 40836 | 40822 | -14 |
0100000US | United States | 310M400US10940 | 10940 | 42476 | 40599 | -1877 |
0100000US | United States | 310M400US10980 | 10980 | 29601 | 28360 | -1241 |
0100000US | United States | 310M400US11060 | 11060 | 26446 | 24949 | -1497 |
0100000US | United States | 310M400US11140 | 11140 | 37827 | 34969 | -2858 |
0100000US | United States | 310M400US11220 | 11220 | 50258 | 49455 | -803 |
0100000US | United States | 310M400US11380 | 11380 | 14786 | 18128 | 3342 |
0100000US | United States | 310M400US11420 | 11420 | 34173 | 34586 | 413 |
0100000US | United States | 310M400US11580 | 11580 | 34862 | 37489 | 2627 |
0100000US | United States | 310M400US11620 | 11620 | 47733 | 48177 | 444 |
0100000US | United States | 310M400US11660 | 11660 | 22993 | 22061 | -932 |
0100000US | United States | 310M400US11680 | 11680 | 36309 | 35218 | -1091 |
0100000US | United States | 310M400US11740 | 11740 | 53140 | 53745 | 605 |
0100000US | United States | 310M400US11780 | 11780 | 101490 | 97493 | -3997 |
0100000US | United States | 310M400US11820 | 11820 | 37026 | 39764 | 2738 |
0100000US | United States | 310M400US11860 | 11860 | 16921 | 16193 | -728 |
0100000US | United States | 310M400US11900 | 11900 | 64764 | 65818 | 1054 |
0100000US | United States | 310M400US11940 | 11940 | 52279 | 53285 | 1006 |
0100000US | United States | 310M400US11980 | 11980 | 78534 | 82299 | 3765 |
0100000US | United States | 310M400US12120 | 12120 | 38320 | 36748 | -1572 |
0100000US | United States | 310M400US12140 | 12140 | 42229 | 43226 | 997 |
0100000US | United States | 310M400US12180 | 12180 | 80017 | 77145 | -2872 |
0100000US | United States | 310M400US12300 | 12300 | 122154 | 122083 | -71 |
0100000US | United States | 310M400US12380 | 12380 | 39163 | 40011 | 848 |
0100000US | United States | 310M400US12460 | 12460 | 27842 | 26575 | -1267 |
0100000US | United States | 310M400US12660 | 12660 | 61965 | 64249 | 2284 |
0100000US | United States | 310M400US12680 | 12680 | 43443 | 45851 | 2408 |
0100000US | United States | 310M400US12740 | 12740 | 59522 | 58140 | -1382 |
0100000US | United States | 310M400US12780 | 12780 | 50977 | 51843 | 866 |
0100000US | United States | 310M400US12820 | 12820 | 27979 | 25398 | -2581 |
0100000US | United States | 310M400US12860 | 12860 | 59943 | 57511 | -2432 |
0100000US | United States | 310M400US12900 | 12900 | 36641 | 37678 | 1037 |
0100000US | United States | 310M400US13060 | 13060 | 36702 | 36552 | -150 |
0100000US | United States | 310M400US13100 | 13100 | 22311 | 21493 | -818 |
0100000US | United States | 310M400US13180 | 13180 | 88759 | 87847 | -912 |
0100000US | United States | 310M400US13260 | 13260 | 46129 | 45668 | -461 |
0100000US | United States | 310M400US13300 | 13300 | 31861 | 32587 | 726 |
0100000US | United States | 310M400US13340 | 13340 | 45851 | 45358 | -493 |
0100000US | United States | 310M400US13420 | 13420 | 44442 | 46847 | 2405 |
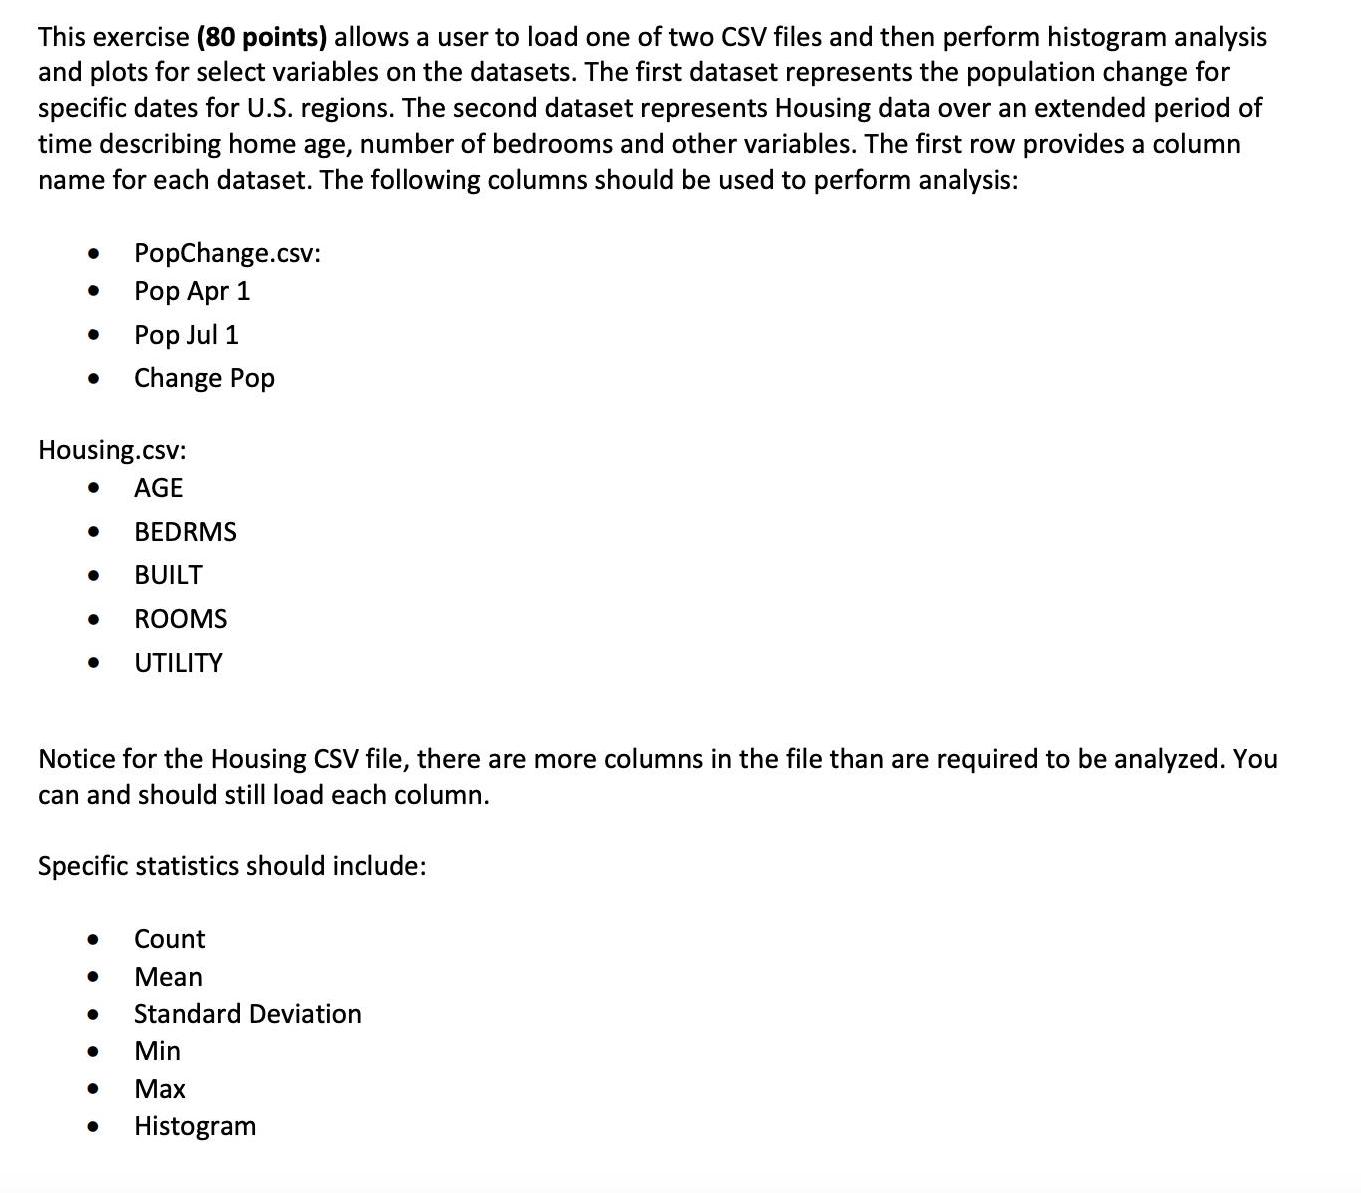
This exercise (80 points) allows a user to load one of two CSV files and then perform histogram analysis and plots for select variables on the datasets. The first dataset represents the population change for specific dates for U.S. regions. The second dataset represents Housing data over an extended period of time describing home age, number of bedrooms and other variables. The first row provides a column name for each dataset. The following columns should be used to perform analysis: Pop Apr 1 Pop Jul 1 Change Pop PopChange.csv: Housing.csv: AGE BEDRMS BUILT ROOMS UTILITY Notice for the Housing CSV file, there are more columns in the file than are required to be analyzed. You can and should still load each column. Specific statistics should include: Count Mean Standard Deviation Min Max Histogram
Step by Step Solution
3.49 Rating (159 Votes )
There are 3 Steps involved in it
Step: 1
The full source code of the program is as follows Notice that 1 The pr...
Get Instant Access to Expert-Tailored Solutions
See step-by-step solutions with expert insights and AI powered tools for academic success
Step: 2

Step: 3

Ace Your Homework with AI
Get the answers you need in no time with our AI-driven, step-by-step assistance
Get Started


