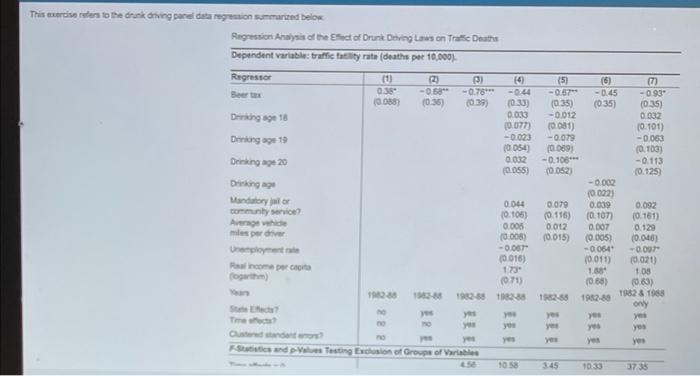
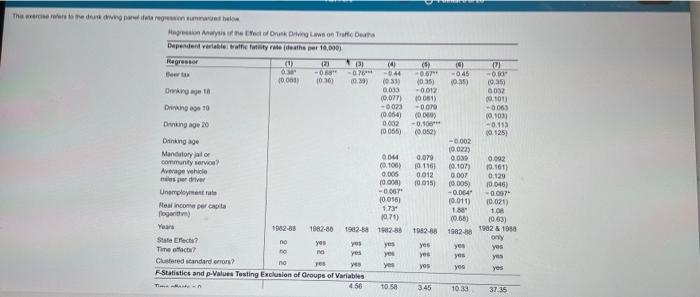
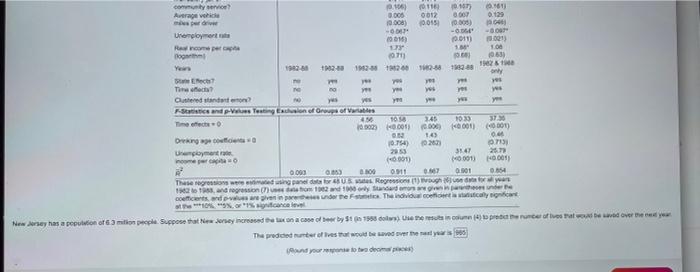
This exercise caters to the drunk driving panel data regression summarized below Regression Analysis of the Britof Drunk Doing son Traffic Death Dependent variable: traffic tality rate (deaths per 10,000) Regressor 11 0.39 10.088 (2) -0.58 (0.35 Dining age 18 ) 14 -0.78*** -0.44 (0.39) 033) 0.033 (0.077) -0.023 10.054) 0.032 Drinking age 19 Deking age 20 Drinking Mandatory lor con service (055) (5) (6) 7 -0.67 -0.45 -0.93" (0.35) (035 (035) -0.012 0.002 10.081) 10.101) -0.079 -0.003 10.0691 0.100) -0.108*** -0.113 (0.052) (0.125) -0.002 (0.0223 0.079 0.039 0.092 (0.116) (0.107 (0.161) 0.012 0.007 0.129 10.015) (0.005) (0.048) -0.064 -0.007 (0.011) (0021 1. 108 (0.68) 1063) 1982-88 1982-80 1982 & 1985 only miles per die 0.064 (0.105) 0.005 (0.008) -0.067 (0016) 1739 (0.71 o per 1903 1990-08 ho ye he Cuando and pe Testing Exclusion of Grows of Vara you yes ye ye yos yes 10.58 145 10.30 3735 LE20 soso SOUD -2500- ca Mandatory 0.644 0.079 0.000 0.00 Age 0176 10.107 (0.161 0.012 0.007 0129 000 00015) 0.005 (0040 -006 -0.007 0.016) 011) 10021 Oogarth 73 1.00 (0 0. 1083) 10-10-30 13 1 Only Tisch Yes Yes Od yes you Sised Testing tons of res Times 6 345 TO 33 3735 0.00 0.00 0.00 0.001) 0001 DO 040 0754 (21) 10713) 2053 510 25 0001 18.000 0.00 OS ng US und yan 1988 Start when the LE SO CHI . 1800 1180 AD 1000 was on her by the proves that would be the The road been Hei 10 -0.45 0350 14 -044 (033) 0.033 10.077) -0023 (0.066) 0.002 10065) (5) -0.61 10.35) -0.012 10081 - 000 (0) -0.100 (0.062) (TI -0.00 19,350 0032 10.101 -0063 10.1031 -0.113 10125 This storheden waren Hegression wyshe Onews on the Dependent variable wifi fit rate the per 10,000 Regreso (0) (2) 3) -0.5 - 076 10.000 10:36 0.39 Onkret Ding99 10 Drinking age 20 Drinking age Mandatory jalor community service Average vehicle te perdre Unemployment Real income per capita logarithm Years 1982-80 State Elects? no yos yo Timet? no yes Clustered standard errors? no YES ys F-Statistics and p-values Testing Exclusion of Groups of Variables 4.56 0.044 0.100) 0.005 10.000 -6667 10.056) 1734 10.71) 0.079 0.116) 0.012 10015) -0.002 10.022) 0.035 (0.100 0007 (0.005) -0.004 (0.016) 1.88 (0.66) 0.092 10.1611 0.129 10.046) -0.007 10.021) 10 1963) 1902 6 1050 Oy yes yes yes 1982-85 1982-83 1982-88 yes yes yer yes yes yos yoo 10.58 345 10.33 3735 200 . OM wo MY2066 M 0.101 011 10.101 Average vehicle 61 0.005 0012 0.129 prie 10.008) 10015 10.308) Unoployment - - 001) 19.011) 3001 Romper 19 1.0 the 0630 1902-1902-18 2120 1828 echt Theo Ne no ye yes ws and posting this form of 4 100 145 3 13.000.000.000 (2000) Deco 16 0.6 10.754) 73 Unoymart 2253 31.47 27 nome 0001 0001 0001 0.000 0911 0.001 35 There were and USA Regretoughout to regression om 100290 is devenind me The Individual coco no CEO 1000 CHO SOLO NO New money has a population of 63 million people suppose that were ned exace of beer by S1 B 1909 om in one poterunterlader wey. The predicted Number of lives would be verslas This exercise caters to the drunk driving panel data regression summarized below Regression Analysis of the Britof Drunk Doing son Traffic Death Dependent variable: traffic tality rate (deaths per 10,000) Regressor 11 0.39 10.088 (2) -0.58 (0.35 Dining age 18 ) 14 -0.78*** -0.44 (0.39) 033) 0.033 (0.077) -0.023 10.054) 0.032 Drinking age 19 Deking age 20 Drinking Mandatory lor con service (055) (5) (6) 7 -0.67 -0.45 -0.93" (0.35) (035 (035) -0.012 0.002 10.081) 10.101) -0.079 -0.003 10.0691 0.100) -0.108*** -0.113 (0.052) (0.125) -0.002 (0.0223 0.079 0.039 0.092 (0.116) (0.107 (0.161) 0.012 0.007 0.129 10.015) (0.005) (0.048) -0.064 -0.007 (0.011) (0021 1. 108 (0.68) 1063) 1982-88 1982-80 1982 & 1985 only miles per die 0.064 (0.105) 0.005 (0.008) -0.067 (0016) 1739 (0.71 o per 1903 1990-08 ho ye he Cuando and pe Testing Exclusion of Grows of Vara you yes ye ye yos yes 10.58 145 10.30 3735 LE20 soso SOUD -2500- ca Mandatory 0.644 0.079 0.000 0.00 Age 0176 10.107 (0.161 0.012 0.007 0129 000 00015) 0.005 (0040 -006 -0.007 0.016) 011) 10021 Oogarth 73 1.00 (0 0. 1083) 10-10-30 13 1 Only Tisch Yes Yes Od yes you Sised Testing tons of res Times 6 345 TO 33 3735 0.00 0.00 0.00 0.001) 0001 DO 040 0754 (21) 10713) 2053 510 25 0001 18.000 0.00 OS ng US und yan 1988 Start when the LE SO CHI . 1800 1180 AD 1000 was on her by the proves that would be the The road been Hei 10 -0.45 0350 14 -044 (033) 0.033 10.077) -0023 (0.066) 0.002 10065) (5) -0.61 10.35) -0.012 10081 - 000 (0) -0.100 (0.062) (TI -0.00 19,350 0032 10.101 -0063 10.1031 -0.113 10125 This storheden waren Hegression wyshe Onews on the Dependent variable wifi fit rate the per 10,000 Regreso (0) (2) 3) -0.5 - 076 10.000 10:36 0.39 Onkret Ding99 10 Drinking age 20 Drinking age Mandatory jalor community service Average vehicle te perdre Unemployment Real income per capita logarithm Years 1982-80 State Elects? no yos yo Timet? no yes Clustered standard errors? no YES ys F-Statistics and p-values Testing Exclusion of Groups of Variables 4.56 0.044 0.100) 0.005 10.000 -6667 10.056) 1734 10.71) 0.079 0.116) 0.012 10015) -0.002 10.022) 0.035 (0.100 0007 (0.005) -0.004 (0.016) 1.88 (0.66) 0.092 10.1611 0.129 10.046) -0.007 10.021) 10 1963) 1902 6 1050 Oy yes yes yes 1982-85 1982-83 1982-88 yes yes yer yes yes yos yoo 10.58 345 10.33 3735 200 . OM wo MY2066 M 0.101 011 10.101 Average vehicle 61 0.005 0012 0.129 prie 10.008) 10015 10.308) Unoployment - - 001) 19.011) 3001 Romper 19 1.0 the 0630 1902-1902-18 2120 1828 echt Theo Ne no ye yes ws and posting this form of 4 100 145 3 13.000.000.000 (2000) Deco 16 0.6 10.754) 73 Unoymart 2253 31.47 27 nome 0001 0001 0001 0.000 0911 0.001 35 There were and USA Regretoughout to regression om 100290 is devenind me The Individual coco no CEO 1000 CHO SOLO NO New money has a population of 63 million people suppose that were ned exace of beer by S1 B 1909 om in one poterunterlader wey. The predicted Number of lives would be verslas