Answered step by step
Verified Expert Solution
Link Copied!

Question

1 Approved Answer

this exercise, you will be plotting data related to a spring stiffness test, along with the proposed line of best fit for the data. force
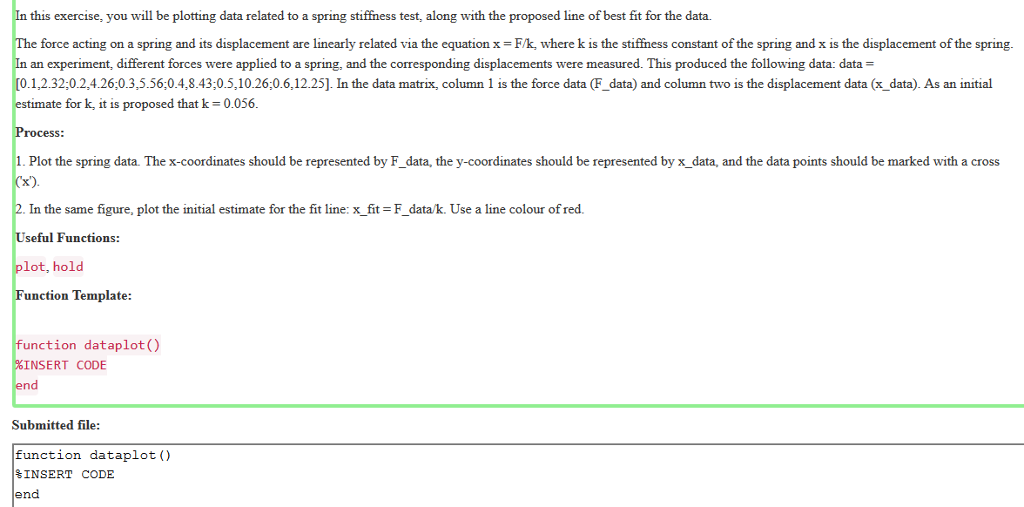
image text in transcribed

this exercise, you will be plotting data related to a spring stiffness test, along with the proposed line of best fit for the data. force acting on a spring and its displacement are linearly related via the equation F/k, where k is the stiffness constant of the spring and x is the displacement of the spring in an experiment, different forces were applied to a spring, and the corresponding displacements were measured. This produced the following data: data 0.1,2.32:0.2,4.26,0.3,5.56:0.4,8.43:0.5,10.26:0.6,12.25]. In the data matrix, column 1 is the force data (F_data) and column two is the displacement data (x data). As an initial stimate for k, it is proposed that k 0.056 Process 1. Plot the spring data. The x-coordinates should be represented by F_data, the y-coordinates should be represented by x_data, and the data points should be marked with a cross In the same figure, plot the initial estimate for the fit line: x_fit-F_data/k. Use a line colour of red Useful Functions plot, hold Function Template function dataplot () %INSERT CODE end Submitted file: function dataplot %INSERT CODE end

Step by Step Solution

There are 3 Steps involved in it

Step: 1

blur-text-image

Get Instant Access to Expert-Tailored Solutions

See step-by-step solutions with expert insights and AI powered tools for academic success

Step: 2

blur-text-image

Step: 3

blur-text-image

Ace Your Homework with AI

Get the answers you need in no time with our AI-driven, step-by-step assistance

Get Started

Recommended Textbook for

Database Design And Implementation

Authors: Edward Sciore

2nd Edition

3030338355, 978-3030338350

Students also viewed these Databases questions

Question

What is the most important part of any HCM Project Map and why?

Answered: 1 week ago