

Answered step by step
Verified Expert Solution
Question
1 Approved Answer
This graph shows the net present value of an investment with annual cash flows of $1,000,$100,$300,$400, and $675 as a function of dimerent costs of
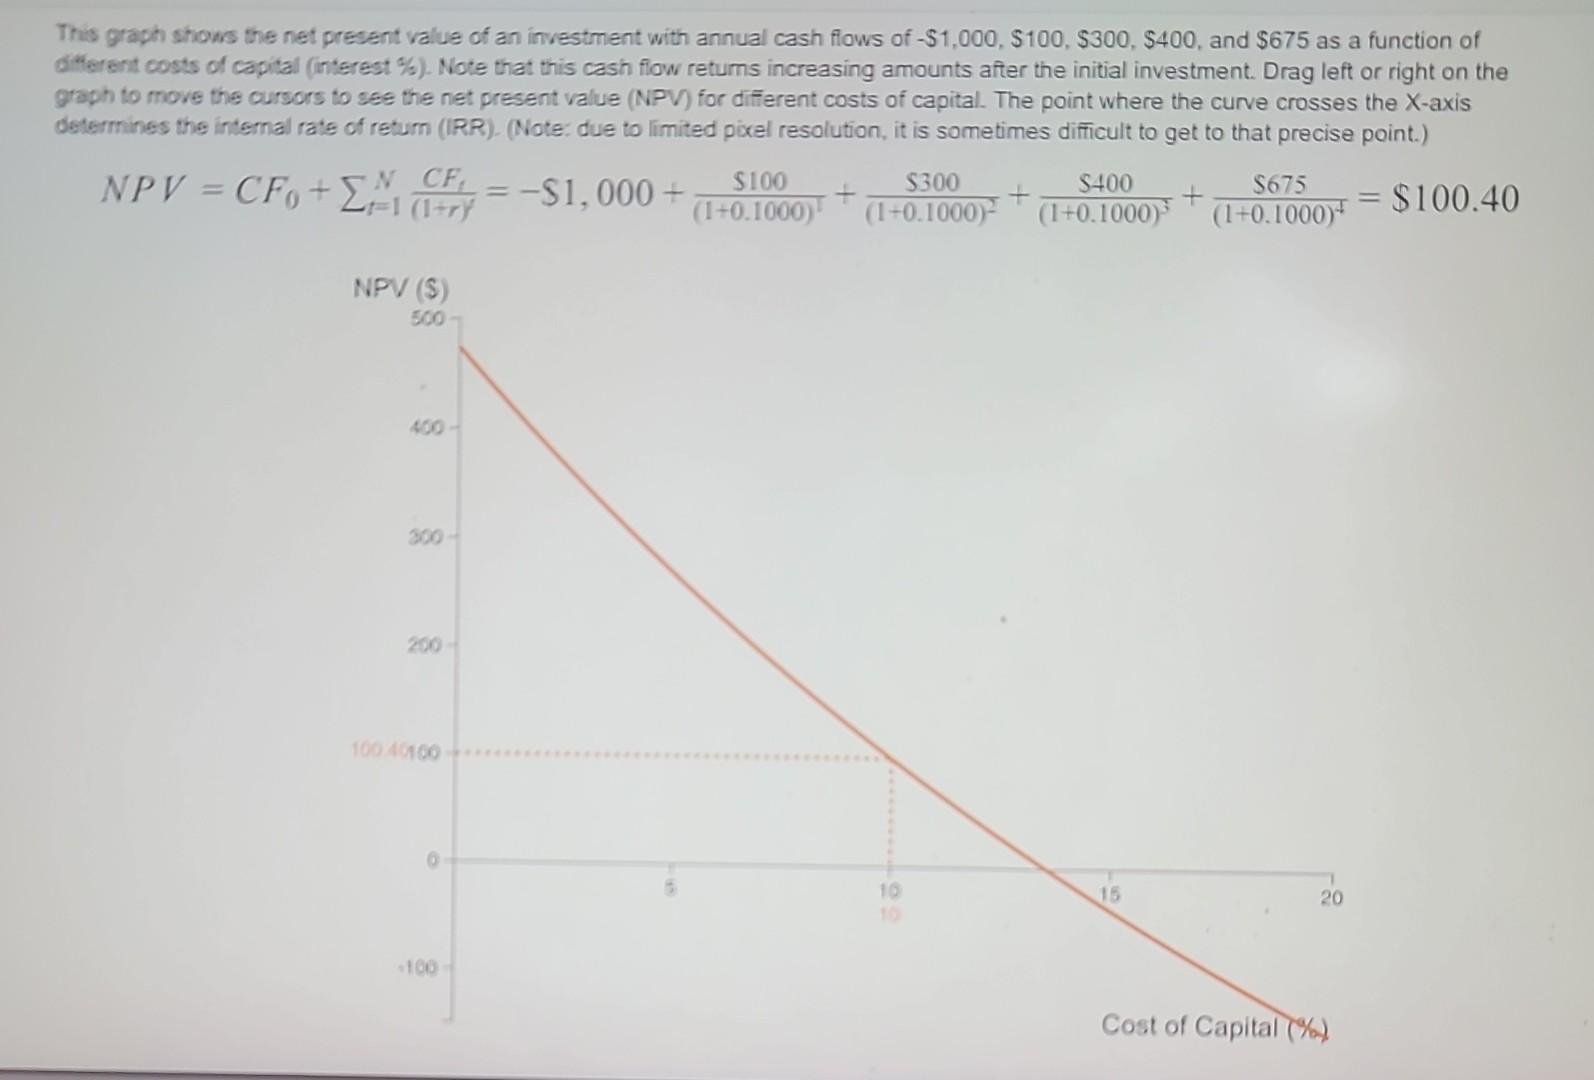
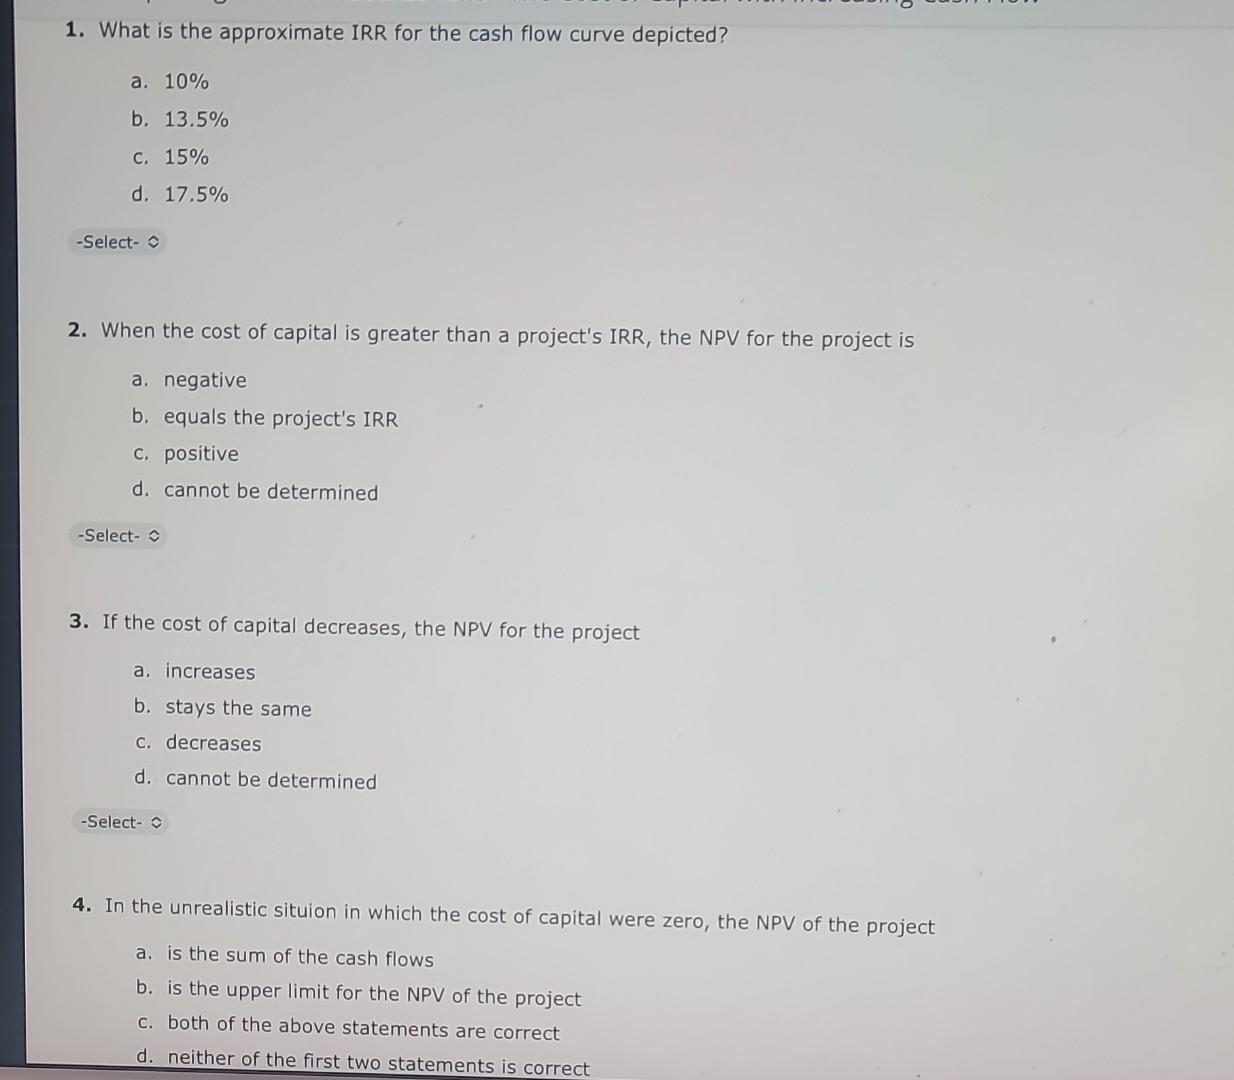
This graph shows the net present value of an investment with annual cash flows of $1,000,$100,$300,$400, and $675 as a function of dimerent costs of capital (interest \%). Note that this cash flow retums increasing amounts after the initial investment. Drag left or right on the graph to move the cursors to see the net present value (NPV) for difierent costs of capital. The point where the curve crosses the X-axis determines the intemal rate of retum (IRR). (Note: due to limited pixel resolution, it is sometimes dificult to get to that precise point.) NPV=CF0+t=1N(1+r)4CFf=S1,000+(1+0.1000)1$100+(1+0.1000)2$300+(1+0.1000)3$400+(1+0.1000)4$675=$100.40 1. What is the approximate IRR for the cash flow curve depicted? a. 10% b. 13.5% c. 15% d. 17.5% 2. When the cost of capital is greater than a project's IRR, the NPV for the project is a. negative b. equals the project's IRR c. positive d. cannot be determined 3. If the cost of capital decreases, the NPV for the project a. increases b. stays the same c. decreases d. cannot be determined 4. In the unrealistic situion in which the cost of capital were zero, the NPV of the project a. is the sum of the cash flows b. is the upper limit for the NPV of the project c. both of the above statements are correct d. neither of the first two statements is correct
Step by Step Solution
There are 3 Steps involved in it
Step: 1

Get Instant Access to Expert-Tailored Solutions
See step-by-step solutions with expert insights and AI powered tools for academic success
Step: 2

Step: 3
Ace Your Homework with AI
Get the answers you need in no time with our AI-driven, step-by-step assistance
Get Started
Day Trading Strategies And Risk Management
Authors: Richard N. Williams
1st Edition
979-8863610528