Answered step by step
Verified Expert Solution
Question
1 Approved Answer
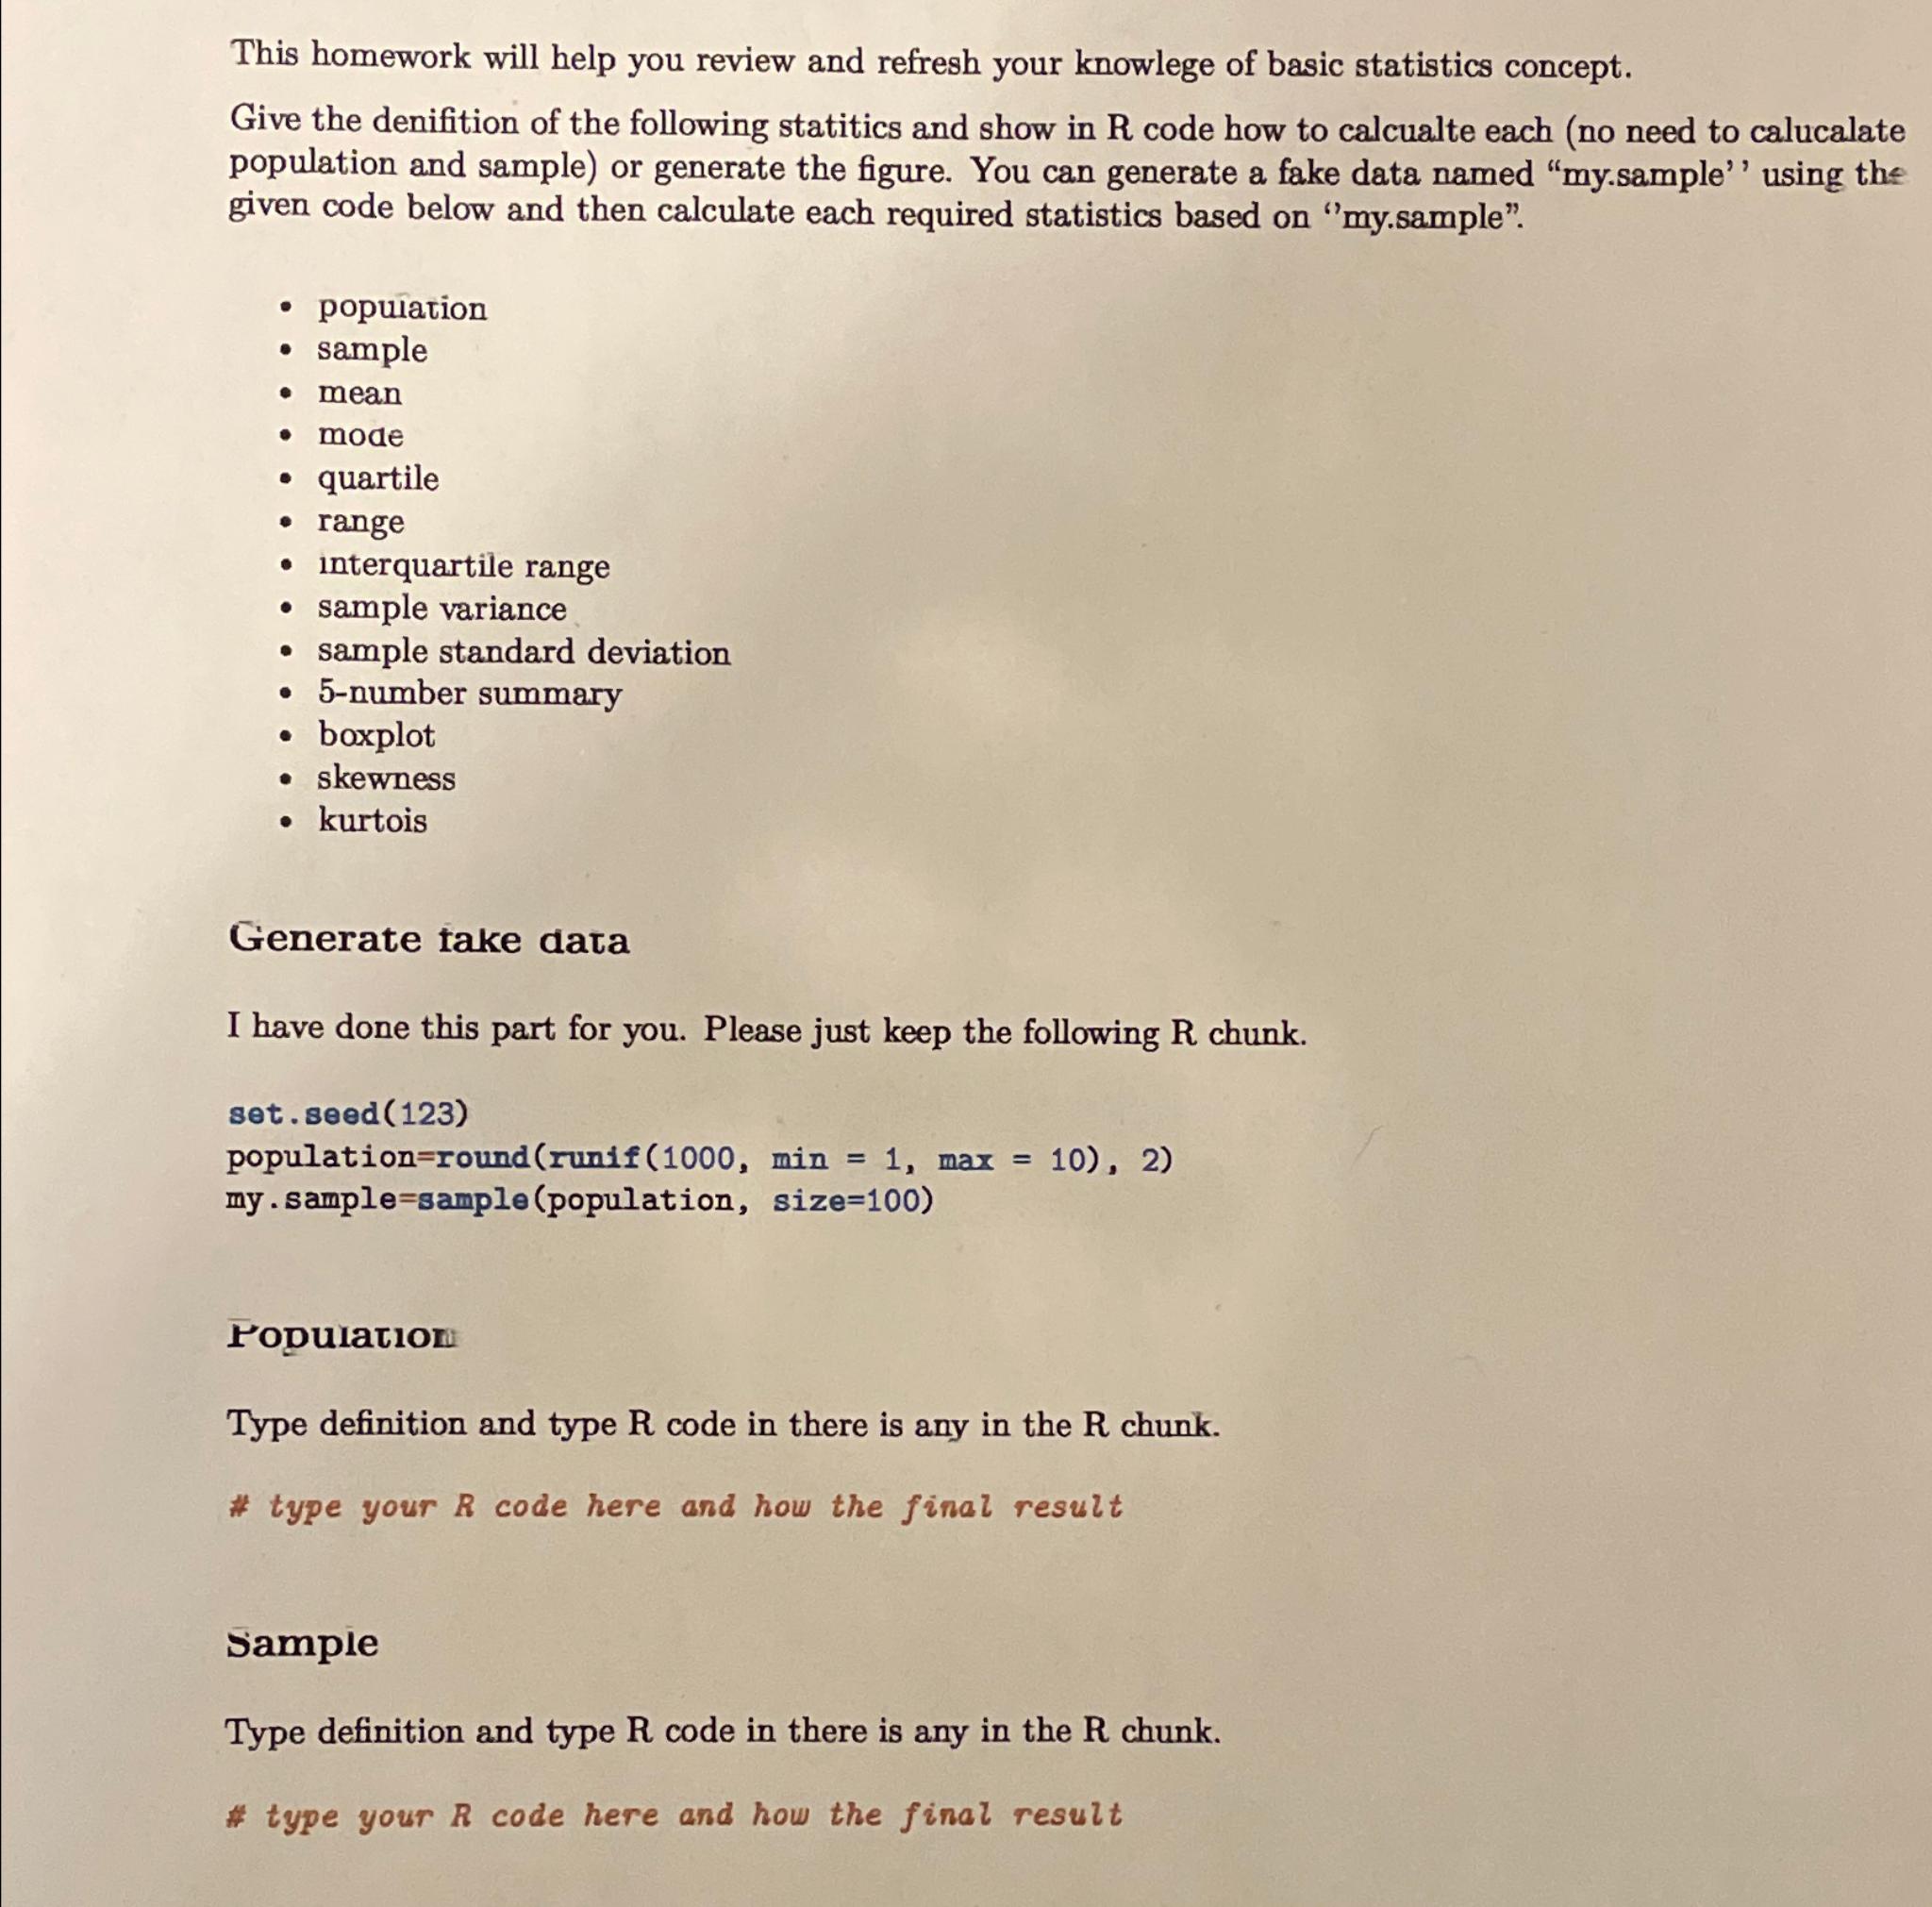
This homework will help you review and refresh your knowlege of basic statistics concept. Give the denifition of the following statitics and show in R
This homework will help you review and refresh your knowlege of basic statistics concept.
Give the denifition of the following statitics and show in code how to calcualte each no need to calucalate population and sample or generate the figure. You can generate a fake data named mysample" using the given code below and then calculate each required statistics based on mysample".
popuiation
sample
mean
mode
quartile
range
interquartile range
sample variance
sample standard deviation
number summary
boxplot
skewness
kurtois
Generate take dara
I have done this part for you. Please just keep the following chunk.
set.seed
populationround runif max
my samplesample population size
ropulation
Type definition and type code in there is any in the chunk.
# type your code here and how the final result
Sample
Type definition and type code in there is any in the chunk.
# type your code here and how the final result

Step by Step Solution
There are 3 Steps involved in it
Step: 1

Get Instant Access to Expert-Tailored Solutions
See step-by-step solutions with expert insights and AI powered tools for academic success
Step: 2

Step: 3

Ace Your Homework with AI
Get the answers you need in no time with our AI-driven, step-by-step assistance
Get Started


