Answered step by step
Verified Expert Solution
Question
1 Approved Answer
This is a biochemistry question and all the information is included in the three pictures. In lab last semester we studied the impact of temperature,
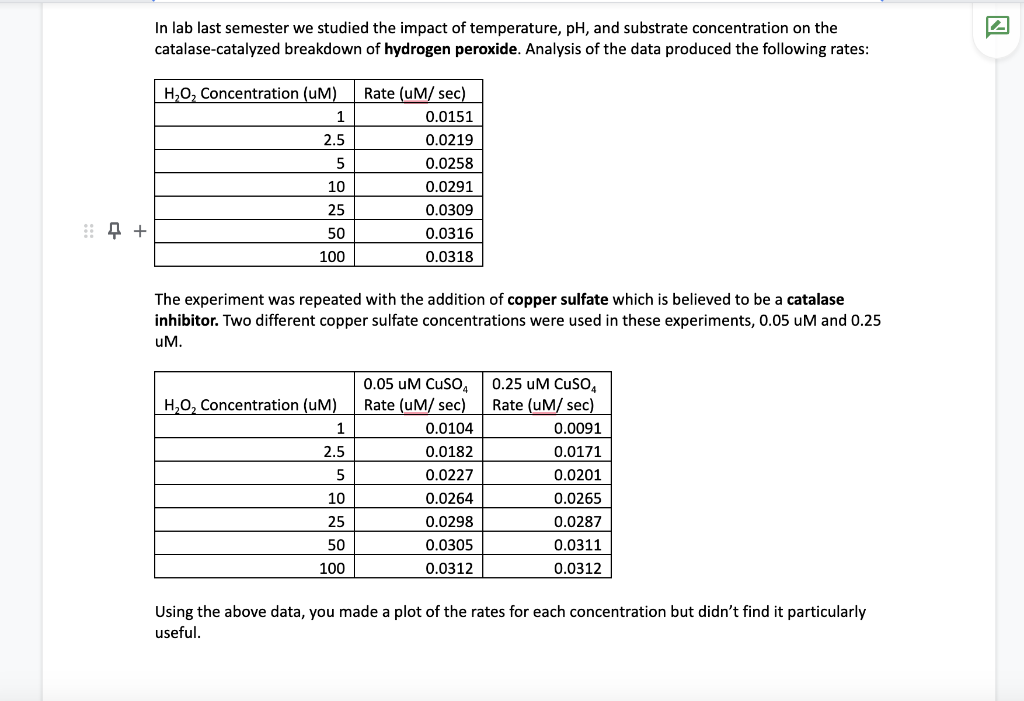
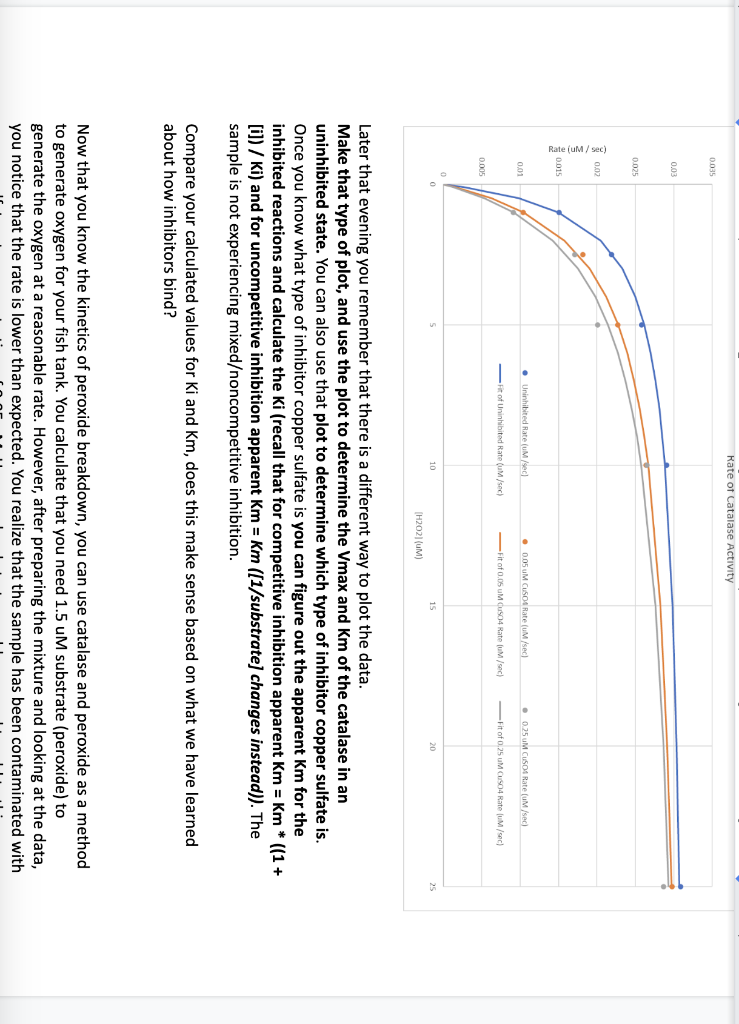
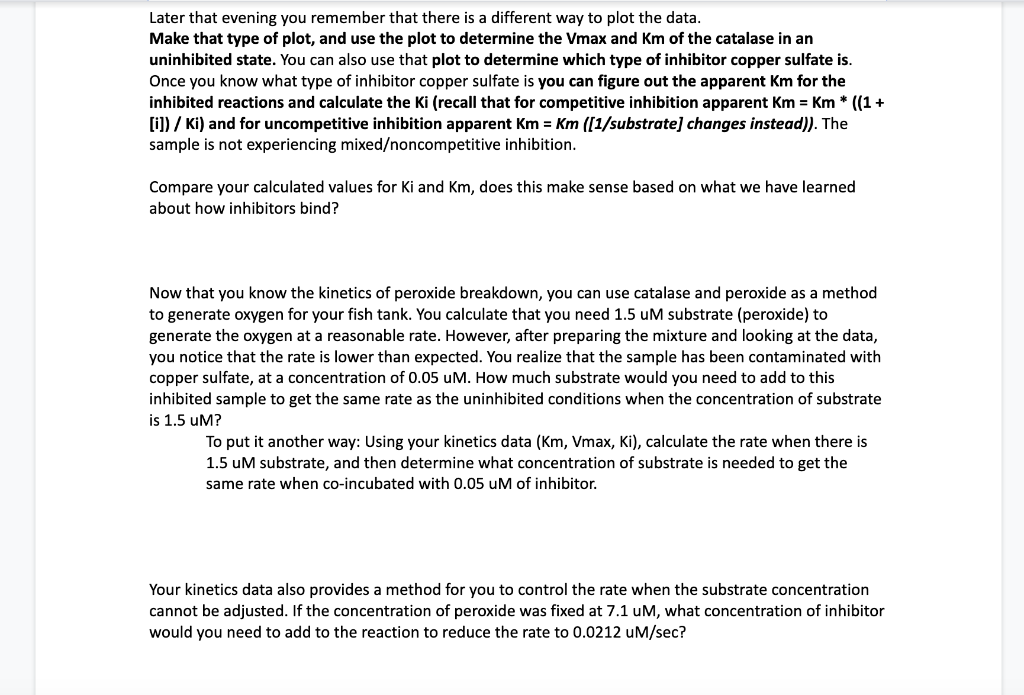
This is a biochemistry question and all the information is included in the three pictures.
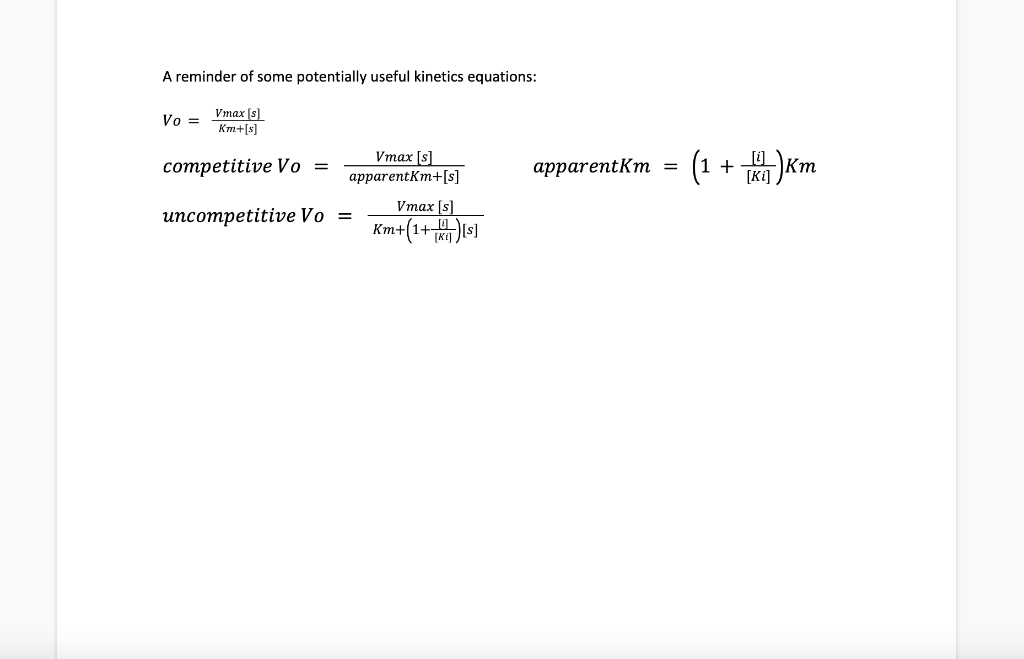
In lab last semester we studied the impact of temperature, pH, and substrate concentration on the catalase-catalyzed breakdown of hydrogen peroxide. Analysis of the data produced the following rates: The experiment was repeated with the addition of copper sulfate which is believed to be a catalase inhibitor. Two different copper sulfate concentrations were used in these experiments, 0.05uM and 0.25 uM. Using the above data, you made a plot of the rates for each concentration but didn't find it particularly useful. Later that evening you remember that there is a different way to plot the data. Make that type of plot, and use the plot to determine the Vmax and Km of the catalase in an uninhibited state. You can also use that plot to determine which type of inhibitor copper sulfate is. Once you know what type of inhibitor copper sulfate is you can figure out the apparent Km for the inhibited reactions and calculate the Ki (recall that for competitive inhibition apparent Km=Km)((1+ [i]) / Ki) and for uncompetitive inhibition apparent Km=Km ([1/substrate] changes instead)). The sample is not experiencing mixedoncompetitive inhibition. Compare your calculated values for Ki and Km, does this make sense based on what we have learned about how inhibitors bind? Now that you know the kinetics of peroxide breakdown, you can use catalase and peroxide as a method to generate oxygen for your fish tank. You calculate that you need 1.5uM substrate (peroxide) to generate the oxygen at a reasonable rate. However, after preparing the mixture and looking at the data, you notice that the rate is lower than expected. You realize that the sample has been contaminated with Later that evening you remember that there is a different way to plot the data. Make that type of plot, and use the plot to determine the Vmax and Km of the catalase in an uninhibited state. You can also use that plot to determine which type of inhibitor copper sulfate is. Once you know what type of inhibitor copper sulfate is you can figure out the apparent Km for the inhibited reactions and calculate the Ki (recall that for competitive inhibition apparent Km=Km((1+ [i]) /Ki ) and for uncompetitive inhibition apparent Km=Km ([1/substrate] changes instead)). The sample is not experiencing mixedoncompetitive inhibition. Compare your calculated values for Ki and Km, does this make sense based on what we have learned about how inhibitors bind? Now that you know the kinetics of peroxide breakdown, you can use catalase and peroxide as a method to generate oxygen for your fish tank. You calculate that you need 1.5uM substrate (peroxide) to generate the oxygen at a reasonable rate. However, after preparing the mixture and looking at the data, you notice that the rate is lower than expected. You realize that the sample has been contaminated with copper sulfate, at a concentration of 0.05uM. How much substrate would you need to add to this inhibited sample to get the same rate as the uninhibited conditions when the concentration of substrate is 1.5uM ? To put it another way: Using your kinetics data ( Km, Vmax, Ki), calculate the rate when there is 1.5uM substrate, and then determine what concentration of substrate is needed to get the same rate when co-incubated with 0.05UM of inhibitor. Your kinetics data also provides a method for you to control the rate when the substrate concentration cannot be adjusted. If the concentration of peroxide was fixed at 7.1uM, what concentration of inhibitor would you need to add to the reaction to reduce the rate to 0.0212uM/sec ? A reminder of some potentially useful kinetics equations: Vo=Km+[s]Vmax[s]competitiveVo=apparentKm+[s]Vmax[s]apparentKm=(1+[Ki][i])KmuncompetitiveVo=Km+(1+[Ki][i])[s]Vmax[s] In lab last semester we studied the impact of temperature, pH, and substrate concentration on the catalase-catalyzed breakdown of hydrogen peroxide. Analysis of the data produced the following rates: The experiment was repeated with the addition of copper sulfate which is believed to be a catalase inhibitor. Two different copper sulfate concentrations were used in these experiments, 0.05uM and 0.25 uM. Using the above data, you made a plot of the rates for each concentration but didn't find it particularly useful. Later that evening you remember that there is a different way to plot the data. Make that type of plot, and use the plot to determine the Vmax and Km of the catalase in an uninhibited state. You can also use that plot to determine which type of inhibitor copper sulfate is. Once you know what type of inhibitor copper sulfate is you can figure out the apparent Km for the inhibited reactions and calculate the Ki (recall that for competitive inhibition apparent Km=Km)((1+ [i]) / Ki) and for uncompetitive inhibition apparent Km=Km ([1/substrate] changes instead)). The sample is not experiencing mixedoncompetitive inhibition. Compare your calculated values for Ki and Km, does this make sense based on what we have learned about how inhibitors bind? Now that you know the kinetics of peroxide breakdown, you can use catalase and peroxide as a method to generate oxygen for your fish tank. You calculate that you need 1.5uM substrate (peroxide) to generate the oxygen at a reasonable rate. However, after preparing the mixture and looking at the data, you notice that the rate is lower than expected. You realize that the sample has been contaminated with Later that evening you remember that there is a different way to plot the data. Make that type of plot, and use the plot to determine the Vmax and Km of the catalase in an uninhibited state. You can also use that plot to determine which type of inhibitor copper sulfate is. Once you know what type of inhibitor copper sulfate is you can figure out the apparent Km for the inhibited reactions and calculate the Ki (recall that for competitive inhibition apparent Km=Km((1+ [i]) /Ki ) and for uncompetitive inhibition apparent Km=Km ([1/substrate] changes instead)). The sample is not experiencing mixedoncompetitive inhibition. Compare your calculated values for Ki and Km, does this make sense based on what we have learned about how inhibitors bind? Now that you know the kinetics of peroxide breakdown, you can use catalase and peroxide as a method to generate oxygen for your fish tank. You calculate that you need 1.5uM substrate (peroxide) to generate the oxygen at a reasonable rate. However, after preparing the mixture and looking at the data, you notice that the rate is lower than expected. You realize that the sample has been contaminated with copper sulfate, at a concentration of 0.05uM. How much substrate would you need to add to this inhibited sample to get the same rate as the uninhibited conditions when the concentration of substrate is 1.5uM ? To put it another way: Using your kinetics data ( Km, Vmax, Ki), calculate the rate when there is 1.5uM substrate, and then determine what concentration of substrate is needed to get the same rate when co-incubated with 0.05UM of inhibitor. Your kinetics data also provides a method for you to control the rate when the substrate concentration cannot be adjusted. If the concentration of peroxide was fixed at 7.1uM, what concentration of inhibitor would you need to add to the reaction to reduce the rate to 0.0212uM/sec ? A reminder of some potentially useful kinetics equations: Vo=Km+[s]Vmax[s]competitiveVo=apparentKm+[s]Vmax[s]apparentKm=(1+[Ki][i])KmuncompetitiveVo=Km+(1+[Ki][i])[s]Vmax[s] Step by Step Solution
There are 3 Steps involved in it
Step: 1

Get Instant Access to Expert-Tailored Solutions
See step-by-step solutions with expert insights and AI powered tools for academic success
Step: 2

Step: 3

Ace Your Homework with AI
Get the answers you need in no time with our AI-driven, step-by-step assistance
Get Started


