

Answered step by step
Verified Expert Solution
Question
1 Approved Answer
this is a business stats question i marked it under accounting sorry a. Run an ANOVA to compare the mean price of your three vehicle
this is a business stats question i marked it under accounting sorry
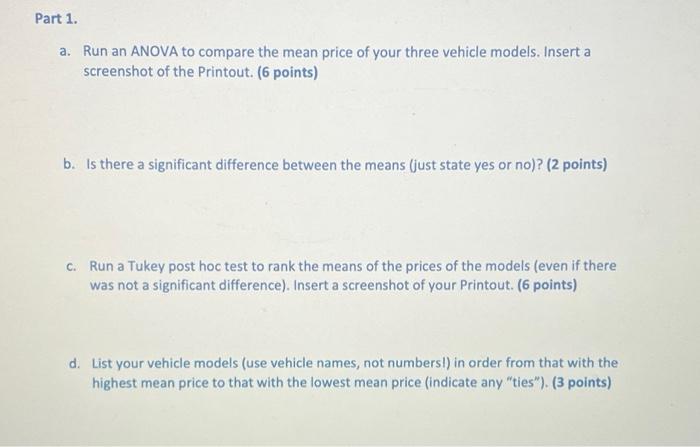
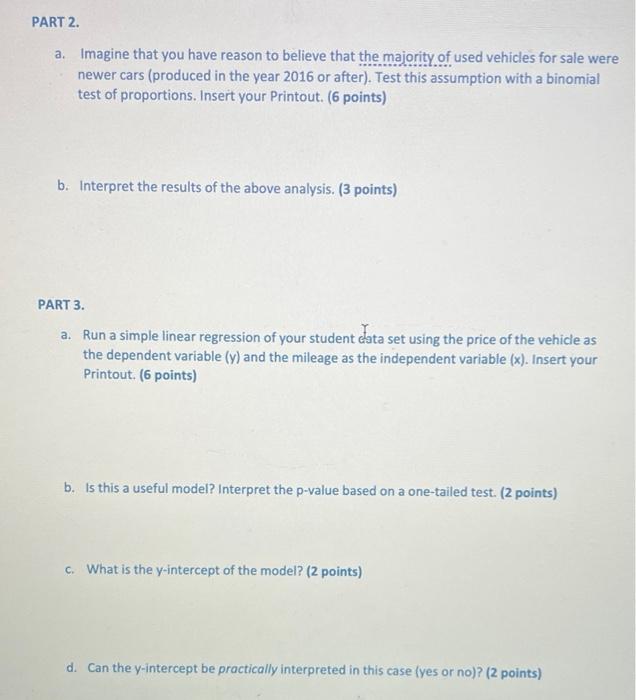
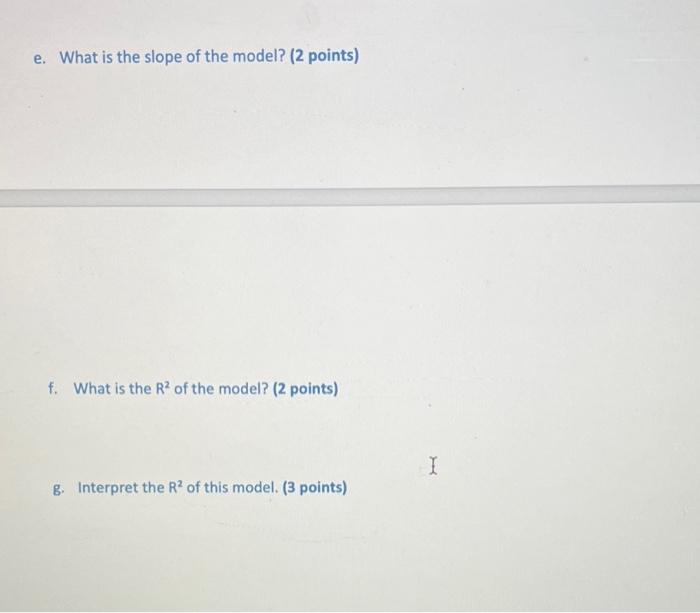
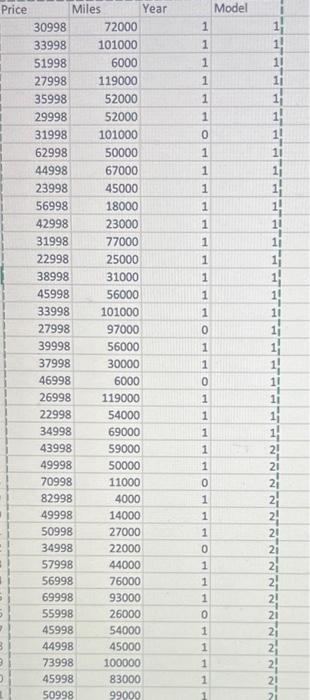
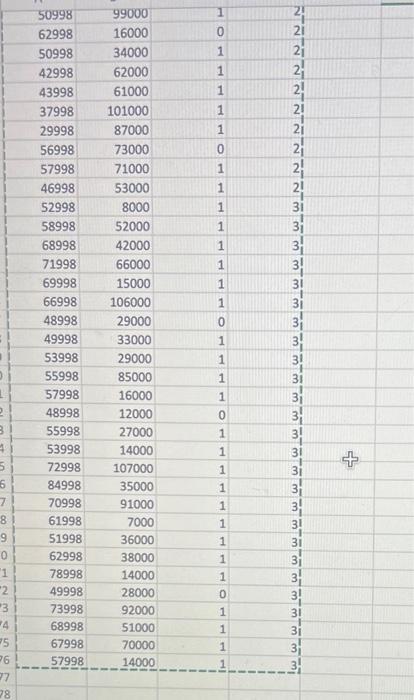
a. Run an ANOVA to compare the mean price of your three vehicle models. Insert a screenshot of the Printout. ( 6 points) b. Is there a significant difference between the means (just state yes or no)? (2 points) c. Run a Tukey post hoc test to rank the means of the prices of the models (even if there was not a significant difference). Insert a screenshot of your Printout. ( 6 points) d. List your vehicle models (use vehicle names, not numbersl) in order from that with the highest mean price to that with the lowest mean price (indicate any "ties"). (3 points) a. Imagine that you have reason to believe that the majority of used vehicles for sale were newer cars (produced in the year 2016 or after). Test this assumption with a binomial test of proportions. Insert your Printout. ( 6 points) b. Interpret the results of the above analysis. ( 3 points) PART 3. a. Run a simple linear regression of your student cata set using the price of the vehicle as the dependent variable (y) and the mileage as the independent variable (x). Insert your Printout. ( 6 points) b. Is this a useful model? Interpret the p-value based on a one-tailed test. ( 2 points) c. What is the y-intercept of the model? (2 points) d. Can the y-intercept be practically interpreted in this case (yes or no)? (2 points) e. What is the slope of the model? (2 points) f. What is the R2 of the model? (2 points) g. Interpret the R2 of this model. (3 points) a. Run an ANOVA to compare the mean price of your three vehicle models. Insert a screenshot of the Printout. ( 6 points) b. Is there a significant difference between the means (just state yes or no)? (2 points) c. Run a Tukey post hoc test to rank the means of the prices of the models (even if there was not a significant difference). Insert a screenshot of your Printout. ( 6 points) d. List your vehicle models (use vehicle names, not numbersl) in order from that with the highest mean price to that with the lowest mean price (indicate any "ties"). (3 points) a. Imagine that you have reason to believe that the majority of used vehicles for sale were newer cars (produced in the year 2016 or after). Test this assumption with a binomial test of proportions. Insert your Printout. ( 6 points) b. Interpret the results of the above analysis. ( 3 points) PART 3. a. Run a simple linear regression of your student cata set using the price of the vehicle as the dependent variable (y) and the mileage as the independent variable (x). Insert your Printout. ( 6 points) b. Is this a useful model? Interpret the p-value based on a one-tailed test. ( 2 points) c. What is the y-intercept of the model? (2 points) d. Can the y-intercept be practically interpreted in this case (yes or no)? (2 points) e. What is the slope of the model? (2 points) f. What is the R2 of the model? (2 points) g. Interpret the R2 of this model. (3 points) Step by Step Solution
There are 3 Steps involved in it
Step: 1

Get Instant Access to Expert-Tailored Solutions
See step-by-step solutions with expert insights and AI powered tools for academic success
Step: 2

Step: 3
Ace Your Homework with AI
Get the answers you need in no time with our AI-driven, step-by-step assistance
Get Started
Final Work On Internal Audit Internal Audit And Its Management
Authors: Silvia Mamani
1st Edition
6203099651, 978-6203099652