Question
This is a MatLAB Based Problem. Thanks for the help!! :) Temp1: 0.005 0.040 0.135 0.320 0.625 1.080 1.715 2.560 3.645 5.000 6.655 8.640 10.985
This is a MatLAB Based Problem. Thanks for the help!! :) Temp1: 0.005 0.040 0.135 0.320 0.625 1.080 1.715 2.560 3.645 5.000 6.655 8.640 10.985 13.720 16.875 20.480 24.565 29.160 34.295 40.000 46.305 53.240 60.835 69.120 78.125 87.880 98.415 109.760 121.945 135.000 148.955 163.840 179.685 196.520 214.375 233.280 253.265 274.360 296.595 320.000 344.605 370.440 397.535 425.920 455.625 486.680 519.115 552.960 588.245 625.000
Temp 2: 625.250 625.500 625.750 626.000 626.250 626.500 626.750 627.000 627.250 627.500 627.750 628.000 628.250 628.500 628.750 629.000 629.250 629.500 629.750 630.000 630.250 630.500 630.750 631.000 631.250 631.500 631.750 632.000 632.250 632.500 632.750 633.000 633.250 633.500 633.750 634.000 634.250 634.500 634.750 635.000 635.250 635.500 635.750 636.000 636.250 636.500 636.750 637.000 637.250 637.500 Temp 3: 637.496 637.468 637.392 637.244 637.000 636.636 636.128 635.452 634.584 633.500 632.176 630.588 628.712 626.524 624.000 621.116 617.848 614.172 610.064 605.500 600.456 594.908 588.832 582.204 575.000 567.196 558.768 549.692 539.944 529.500 518.336 506.428 493.752 480.284 466.000 450.876 434.888 418.012 400.224 381.500 361.816 341.148 319.472 296.764 273.000 248.156 222.208 195.132 166.904 137.500 Time 1: 1 2 3 4 5 6 7 8 9 10 11 12 13 14 15 16 17 18 19 20 21 22 23 24 25 26 27 28 29 30 31 32 33 34 35 36 37 38 39 40 41 42 43 44 45 46 47 48 49 50 Time 2: 51 52 53 54 55 56 57 58 59 60 61 62 63 64 65 66 67 68 69 70 71 72 73 74 75 76 77 78 79 80 81 82 83 84 85 86 87 88 89 90 91 92 93 94 95 96 97 98 99 100 Time 3: 101 102 103 104 105 106 107 108 109 110 111 112 113 114 115 116 117 118 119 120 121 122 123 124 125 126 127 128 129 130 131 132 133 134 135 136 137 138 139 140 141 142 143 144 145 146 147 148 149 150
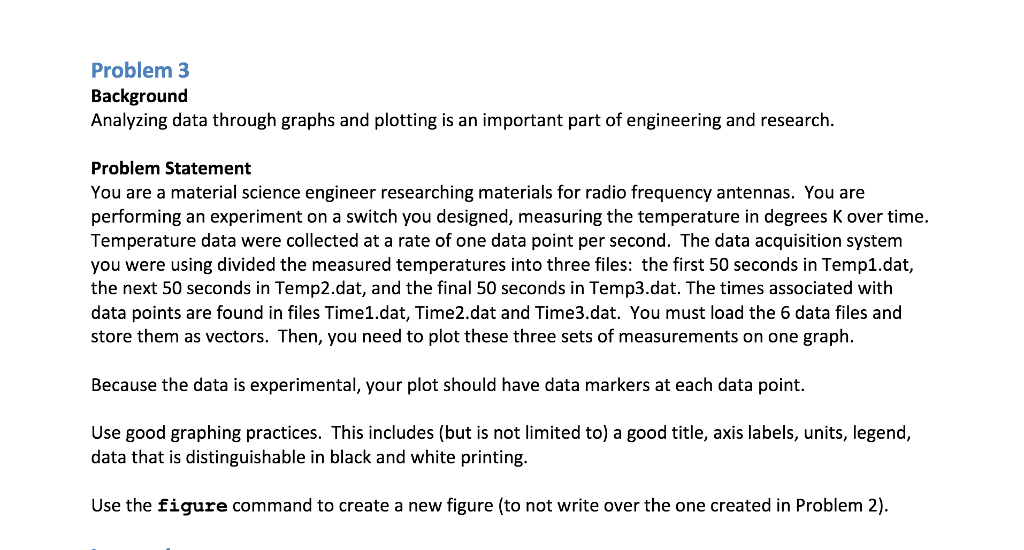
Problem 3 Background Analyzing data through graphs and plotting is an important part of engineering and research. Problem Statement You are a material science engineer researching materials for radio frequency antennas. You are performing an experiment on a switch you designed, measuring the temperature in degrees K over time. Temperature data were collected at a rate of one data point per second. The data acquisition system you were using divided the measured temperatures into three files: the first 50 seconds in Temp1.dat, the next 50 seconds in Temp2.dat, and the final 50 seconds in Temp3.dat. The times associated with data points are found in files Time1.dat, Time2.dat and Time3.dat. You must load the 6 data files and store them as vectors. Then, you need to plot these three sets of measurements on one graph. Because the data is experimental, your plot should have data markers at each data point. Use good graphing practices. This includes (but is not limited to) a good title, axis labels, units, legend, data that is distinguishable in black and white printing. Use the figure command to create a new figure (to not write over the one created in Problem 2)Step by Step Solution
There are 3 Steps involved in it
Step: 1

Get Instant Access to Expert-Tailored Solutions
See step-by-step solutions with expert insights and AI powered tools for academic success
Step: 2

Step: 3

Ace Your Homework with AI
Get the answers you need in no time with our AI-driven, step-by-step assistance
Get Started


