Answered step by step
Verified Expert Solution
Link Copied!

Question

1 Approved Answer

This is a PYTHON program. Thank you. Exercise 3 - Go forth and discover! Find some interesting good sized text datasets (most likely csv's) of

This is a PYTHON program. Thank you.
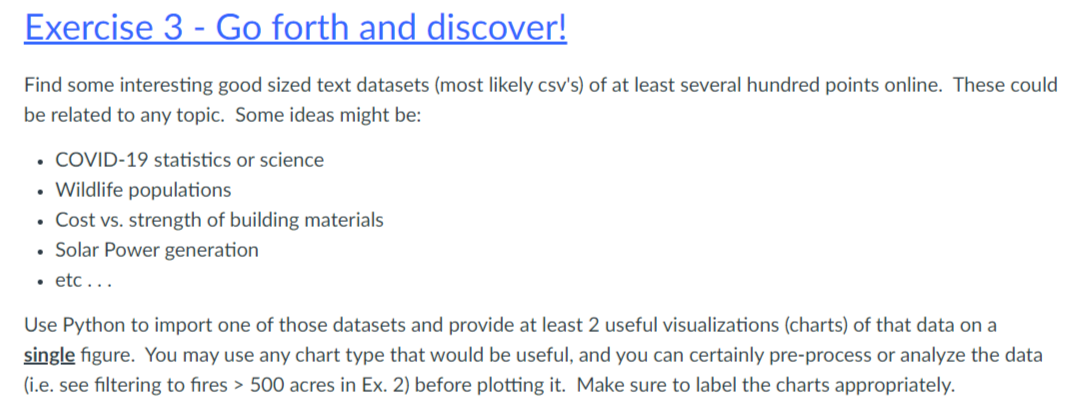
image text in transcribed

Exercise 3 - Go forth and discover! Find some interesting good sized text datasets (most likely csv's) of at least several hundred points online. These could be related to any topic. Some ideas might be: COVID-19 statistics or science Wildlife populations Cost vs. strength of building materials Solar Power generation etc... Use Python to import one of those datasets and provide at least 2 useful visualizations (charts) of that data on a single figure. You may use any chart type that would be useful, and you can certainly pre-process or analyze the data (i.e. see filtering to fires > 500 acres in Ex. 2) before plotting it. Make sure to label the charts appropriately

Step by Step Solution

There are 3 Steps involved in it

Step: 1

blur-text-image

Get Instant Access to Expert-Tailored Solutions

See step-by-step solutions with expert insights and AI powered tools for academic success

Step: 2

blur-text-image_2

Step: 3

blur-text-image_3

Ace Your Homework with AI

Get the answers you need in no time with our AI-driven, step-by-step assistance

Get Started

Recommended Textbook for

MySQL Crash Course A Hands On Introduction To Database Development

Authors: Rick Silva

1st Edition

1718503008, 978-1718503007

More Books

Students also viewed these Databases questions