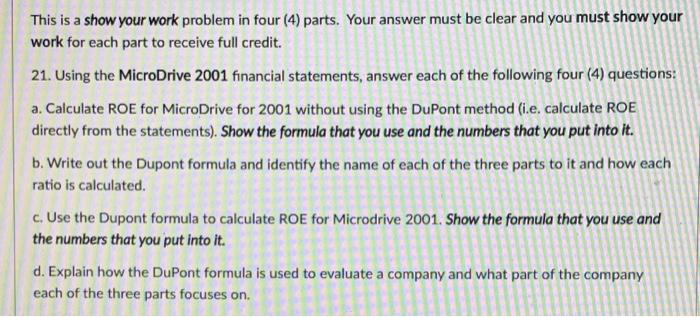
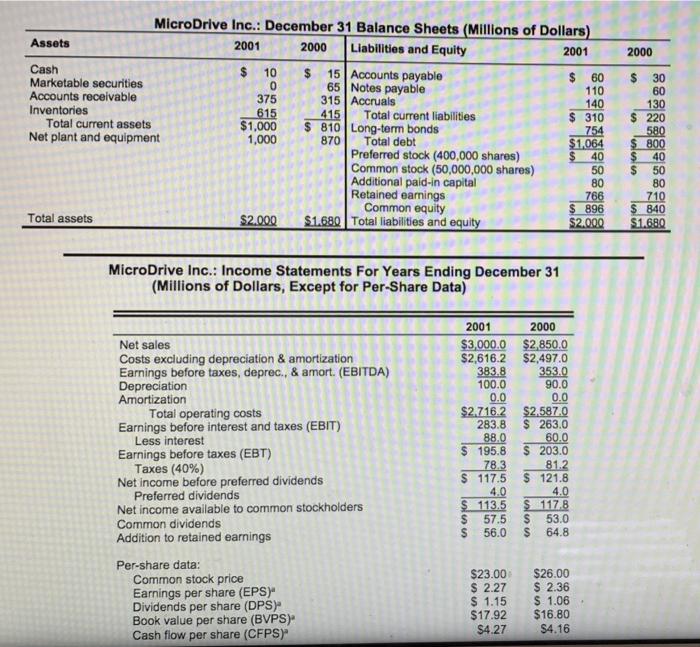
This is a show your work problem in four (4) parts. Your answer must be clear and you must show your work for each part to receive full credit. 21. Using the MicroDrive 2001 financial statements, answer each of the following four (4) questions: a. Calculate ROE for MicroDrive for 2001 without using the DuPont method (i.e. calculate ROE directly from the statements). Show the formula that you use and the numbers that you put into it. b. Write out the Dupont formula and identify the name of each of the three parts to it and how each ratio is calculated. c. Use the Dupont formula to calculate ROE for Microdrive 2001. Show the formula that you use and the numbers that you put into it. d. Explain how the DuPont formula is used to evaluate a company and what part of the company each of the three parts focuses on. 2000 615 MicroDrive Inc.: December 31 Balance Sheets (Millions of Dollars) Assets 2001 2000 Liabilities and Equity 2001 Cash $ 10 $ 15 Accounts payable $ 60 Marketable securities 0 65 Notes payable 110 Accounts receivable 375 315 | Accruals 140 Inventories 415 Total current liabilities $ 310 Total current assets $1,000 $ 810 Long-term bonds 754 Net plant and equipment 1,000 870 Total debt $1.064 Preferred stock (400,000 shares) 40 Common stock (50,000,000 shares) 50 Additional paid-in capital 80 Retained earnings 766 Common equity $ 896 Total assets $2.000 $1.680 Total liabilities and equity $2.000 $ 30 60 130 $ 220 580 $_800 $ 40 50 80 710 $ 840 $1.680 MicroDrive Inc.: Income Statements For Years Ending December 31 (Millions of Dollars, Except for Per-Share Data) Net sales Costs excluding depreciation & amortization Earnings before taxes, deprec., & amort. (EBITDA) Depreciation Amortization Total operating costs Earnings before interest and taxes (EBIT) Less interest Earnings before taxes (EBT) Taxes (40%) Net income before preferred dividends Preferred dividends Net Income available to common stockholders Common dividends Addition to retained earnings Per-share data: Common stock price Earnings per share (EPS)" Dividends per share (DPS) Book value per share (BVPS)" Cash flow per share (CFPS) 2001 2000 $3,000.0 $2,850.0 $2,616.2 $2,497.0 383.8 353.0 100.0 90.0 0.0 0.0 $2.716.2 $2.587.0 283.8 $ 263.0 88.0 60.0 $ 195.8 $ 203.0 78.3 81.2 $ 117.5 $ 121.8 4.0 4.0 $ 113.5 $ 117.8 $ 57.5 $ 53.0 S 56.0 $ 64.8 $23.00 $ 2.27 $ 1.15 $17.92 $4.27 $26.00 $ 2.36 $ 1.06 $16.80 $4.16