this is all i have for this question

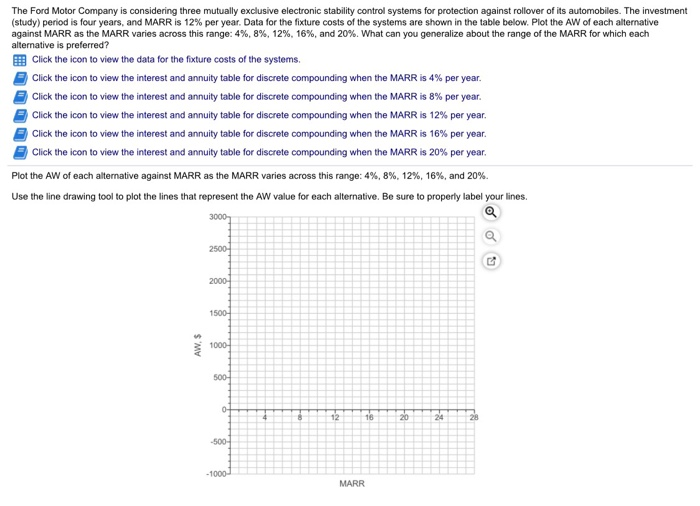
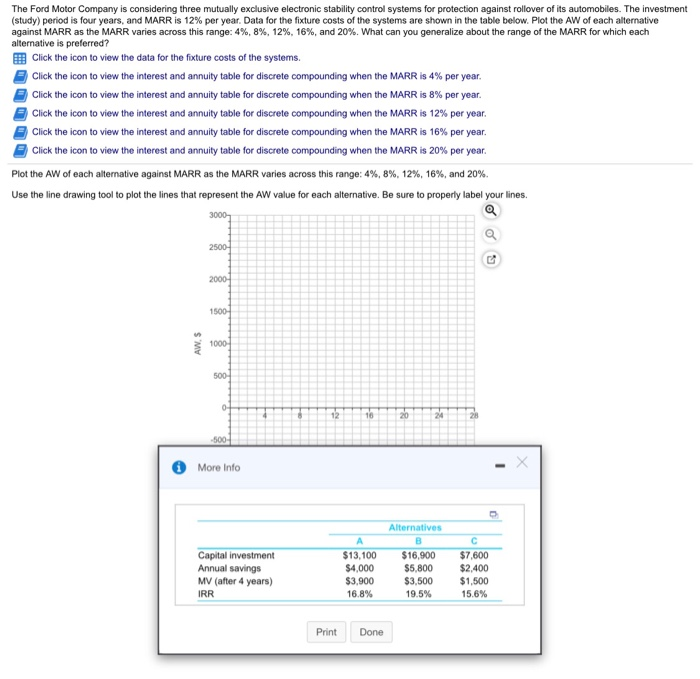
The Ford Motor Company is considering three mutually exclusive electronic stability control systems for protection against rollover of its automobiles. The investment (study) period is four years, and MARR is 12% per year. Data for the fixture costs of the systems are shown in the table below. Plot the AW of each alternative against MARR as the MARR varies across this range: 4%, 8% 12% 16%, and 20% what can you generalize about the range of the MARR for which each alternative is preferred? Click the icon to view the data for the fixture costs of the systems Click the icon to view the interest and annuity table for discrete compounding when the MARR is 4% per year. Click the icon to view the interest and annuity table for discrete compounding when the MARR is 8% per year. Click the icon to view the interest and annuity table for discrete compounding when the MARR is 12% per year. Click the icon to view the interest and annuity table for discrete compounding when the MARR is 16% per year. Click the icon to view the interest and annuity table for discrete compounding when the MARR is 20% per year. Plot the AW of each alternative against MARR as the MARR varies across this range: 4%, 8%, 12%, 16%, and 20%. Use the line drawing tool to plot the lines that represent the AW value for each alternative. Be sure to properly label your lines 2000- 1000 500 1000 MARR The Ford Motor Company is considerre three mutuly exclusivo ao trene stity corte, systerns for protection agunst ralover of its automobiles. Tro nes against MARR as ne MARR vanes across this fange: 4%, 8%, 12%, 16%, and20%. What can you generaize ebut the range of he MARR for which each ahemalive is prelemed? Click the icon to view the data for the fisture costs of the systems Click the con to view the interest and aruly uble for dscrete compondre when MARR ts 4% per year Click tho con to view the interest and annaty Lable for dscrete compeurdng when MARR ts 8% per year caick th con to view the interest and annity lable dscretecompeurdng when MARR ts t216 per year. Click the icon to view the interest and annuity table for discrete compeunding when the MARR is 16%per yeer Click the con to view the interest and aniy table forecrete compeunding when the MARR is 20% per year pot re AiV of each aiternative aganst MARR ss the MARR vmes agoss h8 tang, 4%, 8%, 12%.6%, 20%. Usa the line drawing tool to plot the lines hat repesent the AW value for each altemative Be sure to property label your ines Clear ? The Ford Motor Company is considering three mutually exclusive electronic stability control systems for protection against rollover of its automobiles. The investment (study) period is four years, and MARR is 12% per year. Data for the fixture costs of the systems are shown in the table below. Plot the AW of each alternati against MARR as the MARR varies across this range: 4%, 8%, 12%-16%, and 20%, what can you generalize about the range of the MARR for which each Click the icon to view the data for the fixture costs of the systems Click the icon to view the interest and annuity table for discrete compounding when the MARR is 4% per year. Click the icon to view the interest and annuity table for discrete compounding when the MARR is 8% per year Click the icon to view the interest and annuity table for discrete compounding when the MARR is 12% per year. Click the icon to view the interest and annuity table for discrete compounding when the MARR is 16% per year Click the icon to view the interest and annuity table for discrete compounding when the MARR is 20% per year. Plot the AW of each alternative against MARR as the MARR varies across this range: 4%, 8%, 12%, 16%, and 20%. Use the line drawing tool to plot the lines that represent the AW value for each alternative. Be sure to properly label your lines 20 500 More Info Alternatives Capital investment Annual savings MV (after 4 years) IRR $13,100 $16,900 $7,600 $5,800 $3.500 19.5% $4,000 $3,900 16.8% $2,400 $1,500 15.6% Print Done The Ford Motor Company is considering three mutually exclusive electronic stability control systems for protection against rollover of its automobiles. The investment (study) period is four years, and MARR is 12% per year. Data for the fixture costs of the systems are shown in the table below. Plot the AW of each alternative against MARR as the MARR varies across this range: 4%, 8% 12% 16%, and 20% what can you generalize about the range of the MARR for which each alternative is preferred? Click the icon to view the data for the fixture costs of the systems Click the icon to view the interest and annuity table for discrete compounding when the MARR is 4% per year. Click the icon to view the interest and annuity table for discrete compounding when the MARR is 8% per year. Click the icon to view the interest and annuity table for discrete compounding when the MARR is 12% per year. Click the icon to view the interest and annuity table for discrete compounding when the MARR is 16% per year. Click the icon to view the interest and annuity table for discrete compounding when the MARR is 20% per year. Plot the AW of each alternative against MARR as the MARR varies across this range: 4%, 8%, 12%, 16%, and 20%. Use the line drawing tool to plot the lines that represent the AW value for each alternative. Be sure to properly label your lines 2000- 1000 500 1000 MARR The Ford Motor Company is considerre three mutuly exclusivo ao trene stity corte, systerns for protection agunst ralover of its automobiles. Tro nes against MARR as ne MARR vanes across this fange: 4%, 8%, 12%, 16%, and20%. What can you generaize ebut the range of he MARR for which each ahemalive is prelemed? Click the icon to view the data for the fisture costs of the systems Click the con to view the interest and aruly uble for dscrete compondre when MARR ts 4% per year Click tho con to view the interest and annaty Lable for dscrete compeurdng when MARR ts 8% per year caick th con to view the interest and annity lable dscretecompeurdng when MARR ts t216 per year. Click the icon to view the interest and annuity table for discrete compeunding when the MARR is 16%per yeer Click the con to view the interest and aniy table forecrete compeunding when the MARR is 20% per year pot re AiV of each aiternative aganst MARR ss the MARR vmes agoss h8 tang, 4%, 8%, 12%.6%, 20%. Usa the line drawing tool to plot the lines hat repesent the AW value for each altemative Be sure to property label your ines Clear ? The Ford Motor Company is considering three mutually exclusive electronic stability control systems for protection against rollover of its automobiles. The investment (study) period is four years, and MARR is 12% per year. Data for the fixture costs of the systems are shown in the table below. Plot the AW of each alternati against MARR as the MARR varies across this range: 4%, 8%, 12%-16%, and 20%, what can you generalize about the range of the MARR for which each Click the icon to view the data for the fixture costs of the systems Click the icon to view the interest and annuity table for discrete compounding when the MARR is 4% per year. Click the icon to view the interest and annuity table for discrete compounding when the MARR is 8% per year Click the icon to view the interest and annuity table for discrete compounding when the MARR is 12% per year. Click the icon to view the interest and annuity table for discrete compounding when the MARR is 16% per year Click the icon to view the interest and annuity table for discrete compounding when the MARR is 20% per year. Plot the AW of each alternative against MARR as the MARR varies across this range: 4%, 8%, 12%, 16%, and 20%. Use the line drawing tool to plot the lines that represent the AW value for each alternative. Be sure to properly label your lines 20 500 More Info Alternatives Capital investment Annual savings MV (after 4 years) IRR $13,100 $16,900 $7,600 $5,800 $3.500 19.5% $4,000 $3,900 16.8% $2,400 $1,500 15.6% Print Done


