**This is all of the information I have, I am unable to get more information about the assignment.**


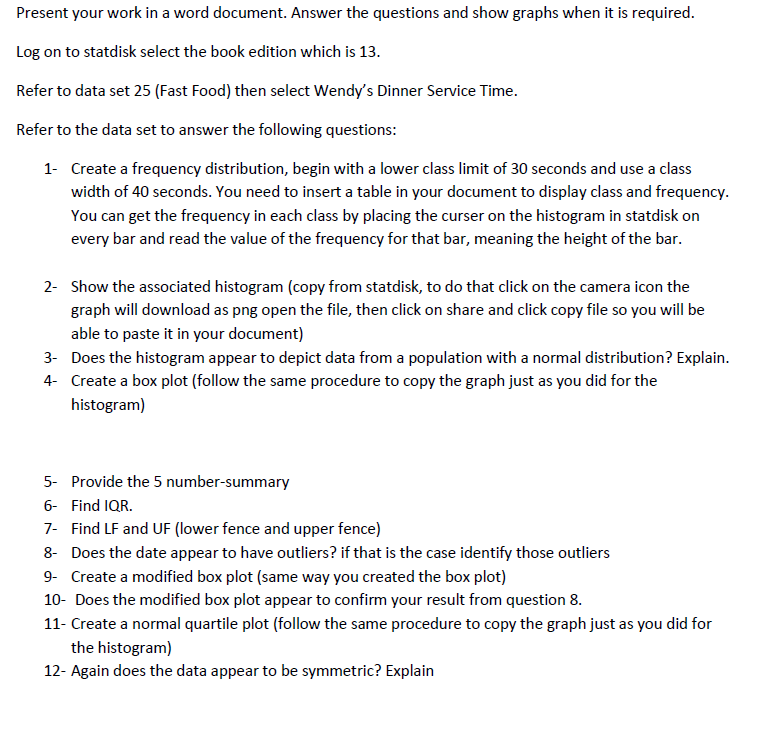
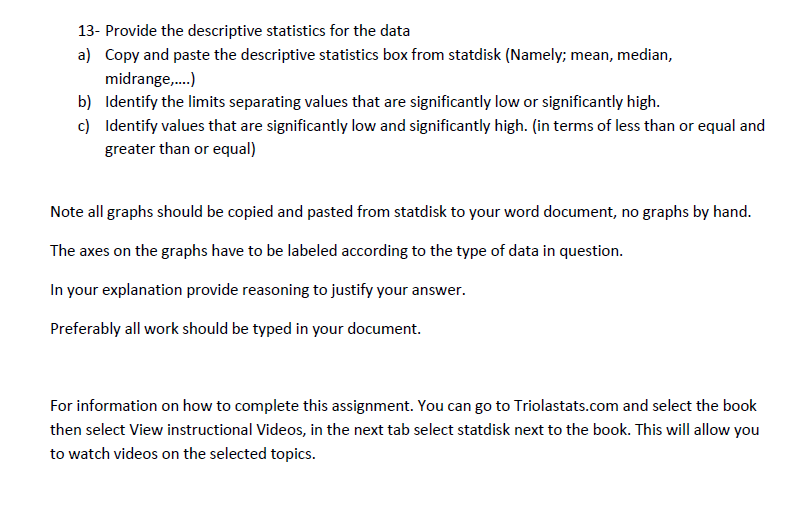
Present your work in a word document. Answer the questions and show graphs when it is required. Log on to statdisk select the book edition which is 13. Refer to data set 25 (Fast Food) then select Wendy's Dinner Service Time. Refer to the data set to answer the following questions: 1- Create a frequency distribution, begin with a lower class limit of 30 seconds and use a class width of 40 seconds. You need to insert a table in your document to display class and frequency. You can get the frequency in each class by placing the curser on the histogram in statdisk on every bar and read the value of the frequency for that bar, meaning the height of the bar. 2- Show the associated histogram (copy from statdisk, to do that click on the camera icon the graph will download as png open the file, then click on share and click copy file so you will be able to paste it in your document) 3- Does the histogram appear to depict data from a population with a normal distribution? Explain. 4- Create a box plot (follow the same procedure to copy the graph just as you did for the histogram) 5- Provide the 5 number-summary 6- Find IQR. 7- Find LF and UF (lower fence and upper fence) 8- Does the date appear to have outliers? if that is the case identify those outliers 9- Create a modified box plot (same way you created the box plot) 10- Does the modified box plot appear to confirm your result from question 8. 11- Create a normal quartile plot (follow the same procedure to copy the graph just as you did for the histogram) 12- Again does the data appear to be symmetric? Explain 13- Provide the descriptive statistics for the data a) Copy and paste the descriptive statistics box from statdisk (Namely; mean, median, midrange,....) b) Identify the limits separating values that are significantly low or significantly high. c) Identify values that are significantly low and significantly high. (in terms of less than or equal and greater than or equal) Note all graphs should be copied and pasted from statdisk to your word document, no graphs by hand. The axes on the graphs have to be labeled according to the type of data in question. In your explanation provide reasoning to justify your answer. Preferably all work should be typed in your document. For information on how to complete this assignment. You can go to Triolastats.com and select the book then select View instructional Videos, in the next tab select statdisk next to the book. This will allow you to watch videos on the selected topics. Present your work in a word document. Answer the questions and show graphs when it is required. Log on to statdisk select the book edition which is 13. Refer to data set 25 (Fast Food) then select Wendy's Dinner Service Time. Refer to the data set to answer the following questions: 1- Create a frequency distribution, begin with a lower class limit of 30 seconds and use a class width of 40 seconds. You need to insert a table in your document to display class and frequency. You can get the frequency in each class by placing the curser on the histogram in statdisk on every bar and read the value of the frequency for that bar, meaning the height of the bar. 2- Show the associated histogram (copy from statdisk, to do that click on the camera icon the graph will download as png open the file, then click on share and click copy file so you will be able to paste it in your document) 3- Does the histogram appear to depict data from a population with a normal distribution? Explain. 4- Create a box plot (follow the same procedure to copy the graph just as you did for the histogram) 5- Provide the 5 number-summary 6- Find IQR. 7- Find LF and UF (lower fence and upper fence) 8- Does the date appear to have outliers? if that is the case identify those outliers 9- Create a modified box plot (same way you created the box plot) 10- Does the modified box plot appear to confirm your result from question 8. 11- Create a normal quartile plot (follow the same procedure to copy the graph just as you did for the histogram) 12- Again does the data appear to be symmetric? Explain 13- Provide the descriptive statistics for the data a) Copy and paste the descriptive statistics box from statdisk (Namely; mean, median, midrange,....) b) Identify the limits separating values that are significantly low or significantly high. c) Identify values that are significantly low and significantly high. (in terms of less than or equal and greater than or equal) Note all graphs should be copied and pasted from statdisk to your word document, no graphs by hand. The axes on the graphs have to be labeled according to the type of data in question. In your explanation provide reasoning to justify your answer. Preferably all work should be typed in your document. For information on how to complete this assignment. You can go to Triolastats.com and select the book then select View instructional Videos, in the next tab select statdisk next to the book. This will allow you to watch videos on the selected topics


