

 This is an excel data cleaning problem. I need help and it is due soon. All steps need to be done in excel.. Please show steps with pictures if possible! Anything will help!
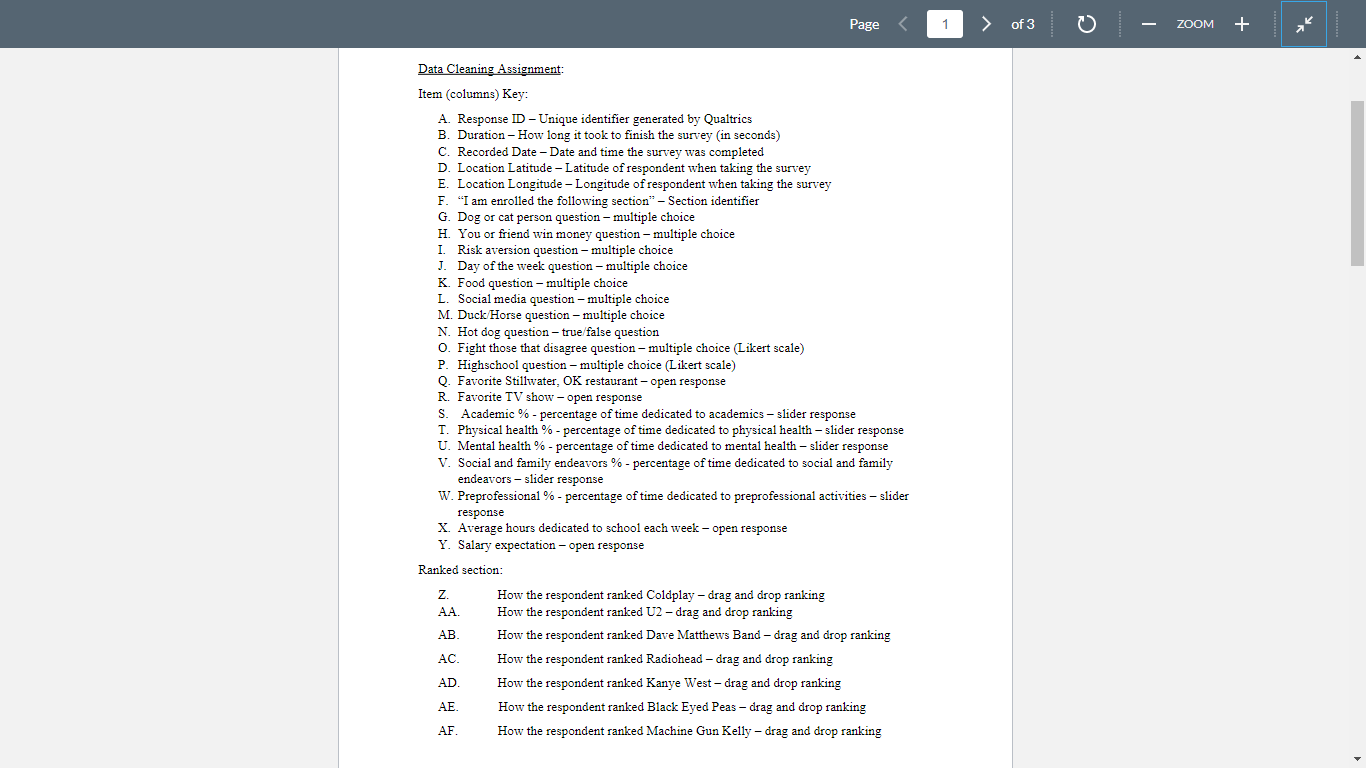
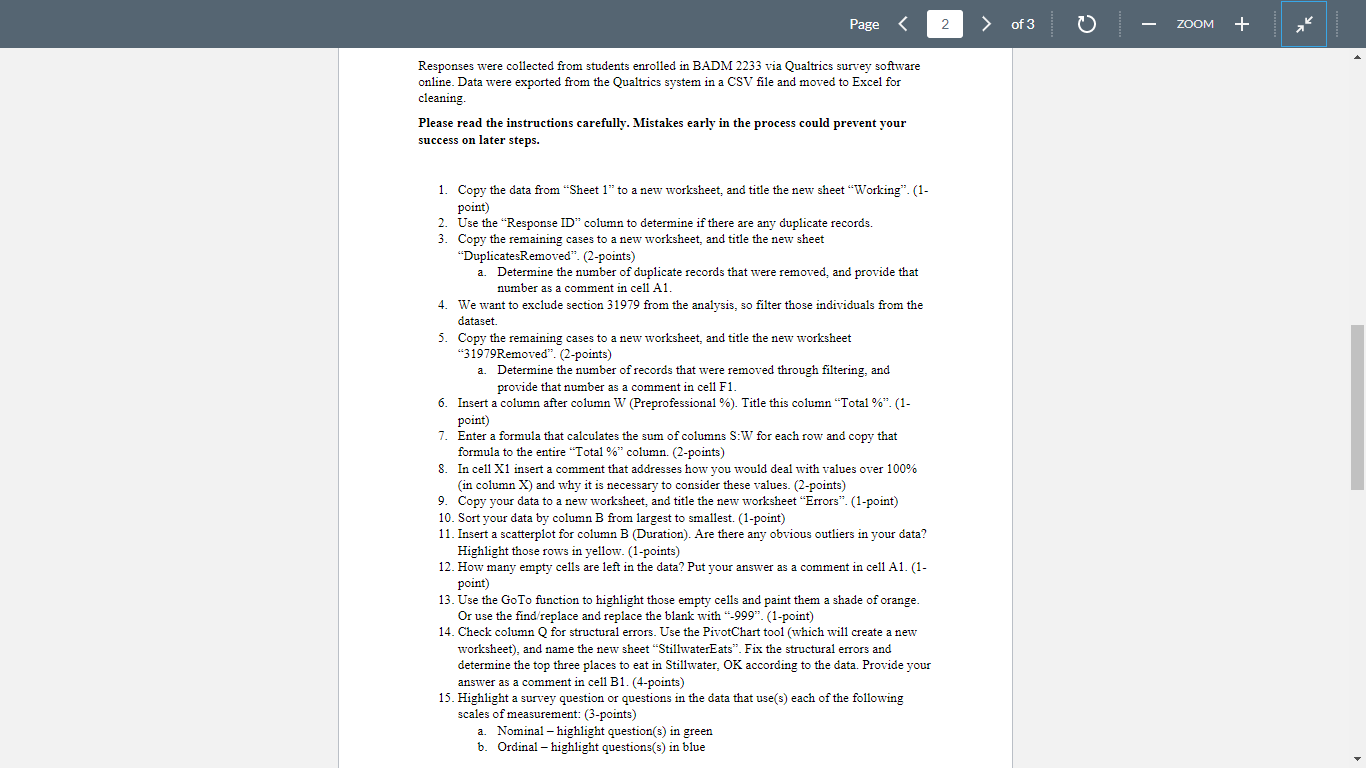
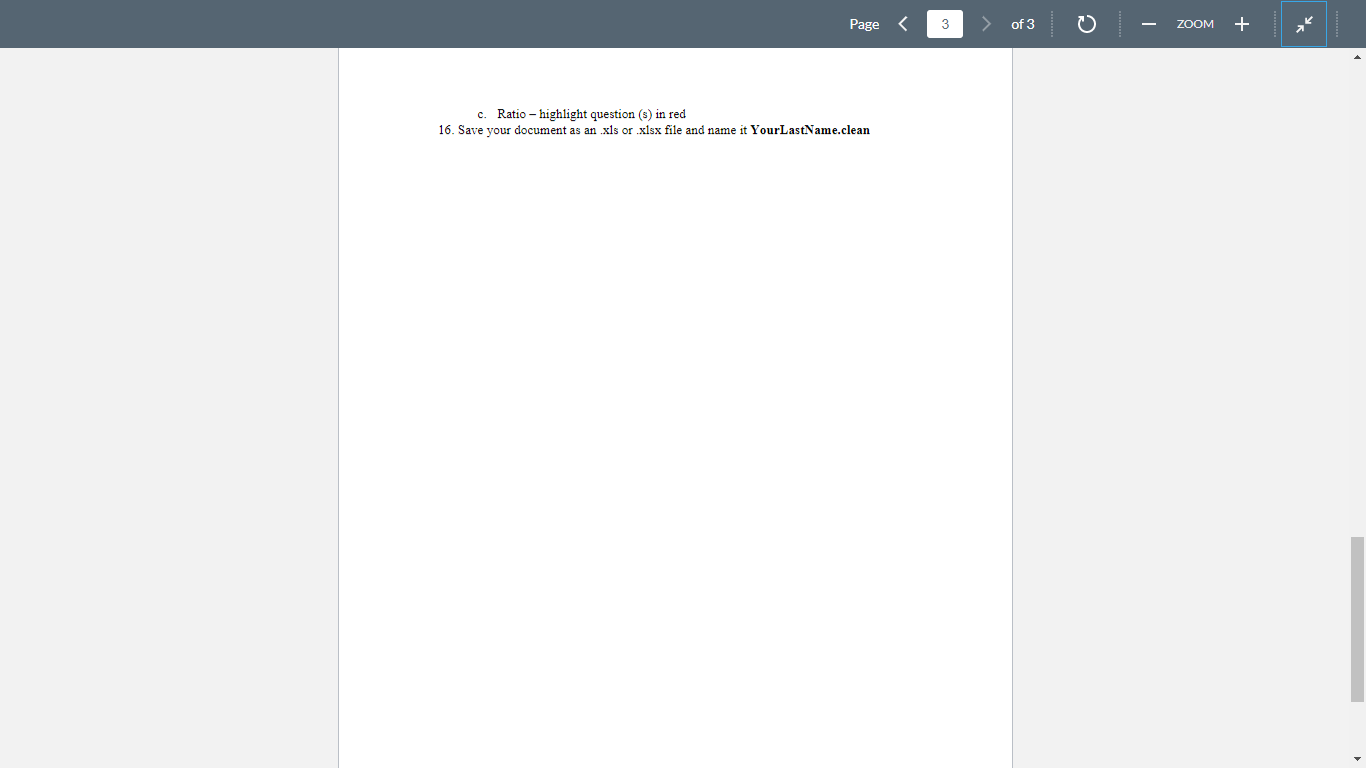
Page 1 of 3 ZOOM + Data Cleaning Assignment: Item (columns) Key: A. Response ID - Unique identifier generated by Qualtrics B. Duration - How long it took to finish the survey (in seconds) C. Recorded Date - Date and time the survey was completed D. Location Latitude - Latitude of respondent when taking the survey E. Location Longitude - Longitude of respondent when taking the survey F. "I am enrolled the following section" Section identifier G. Dog or cat person question multiple choice H. You or friend win money question - multiple choice I Risk aversion question - multiple choice 1. Day of the week question multiple choice K. Food question - multiple choice L. Social media question - multiple choice M. Duck Horse question multiple choice N. Hot dog question - true false question total o. Fight those that disagree question multiple choice (Likert scale) Highschool question - multiple choice (Likert scale) Q. Favorite Stillwater, OK restaurant - open response R. Favorite TV show- open response S. Academic %-percentage of time dedicated to academics - slider response T. Physical health %-percentage of time dedicated to physical health slider response U. Mental health % - percentage of time dedicated to mental health slider response V. Social family endeavors % - percentage of time to social and famil endeavors - slider response W. Preprofessional %-percentage of time dedicated to preprofessional activities slider response X. Average hours dedicated to school each week - open response Y. Salary expectation - open response Ranked section: How the respondent ranked Coldplay - drag and drop ranking AA How the respondent ranked U2 - drag and drop ranking . How the respondent ranked Dave Matthews Band drag and drop ranking AC. How the respondent ranked Radiohead - drag and drop ranking AD. How the respondent ranked Kanye West - drag and drop ranking AE. How the respondent ranked Black Eyed Peas - drag and drop ranking AF. How the respondent ranked Machine Gun Kelly - drag and drop ranking Z Page 2 of 3 ZOOM + Responses were collected from students enrolled in BADM 2233 via Qualtrics survey software online. Data were exported from the Qualtrics system in a CSV file and moved to Excel for cleaning. Please read the instructions carefully. Mistakes early in the process could prevent your success on later steps. 1. Copy the data from "Sheet 1" to a new worksheet, and title the new sheet Working (1- point) 2. Use the "Response ID" column to determine if there are any duplicate records. 3. Copy the remaining cases to a new worksheet, and title the new sheet "DuplicatesRemoved". (2-points) a. Determine the number of duplicate records that were removed, and provide that number as a comment in cell A1. 4. We want to exclude section 31979 from the analysis, so filter those individuals from the dataset. 5. Copy the remaining cases to a new worksheet, and title the new worksheet 31979Removed" (2-points) a. Determine the number of records that were removed through filtering, and provide that number as a comment in cell F1. 6. Insert a column after column W (Preprofessional %). Title this column "Total%".(1- point) 7. Enter a formula that calculates the sum of columns S:W for each row and copy that formula to the entire "Total%" column. (2-points) 8. cell X1 insert a comment that addresses how you would deal with values over 100% a (in column X) and why it is necessary to consider these values. (2-points) 9. Copy your data to a new worksheet, and title the new worksheet Errors". (1-point) 10. Sort your data by column B from largest to smallest. (1-point) 11. Insert a scatterplot for column B (Duration). Are there any obvious outliers in your data? Highlight those rows in yellow. (1-points) 12 How many empty cells are left in the data? Put your answer as a comment in cell A1. (1- point) 13. Use the Go To function to highlight those empty cells and paint them a shade of orange. Or use the find/replace and replace the blank with "-999". (1-point) cu 14. Check column Q for structural errors. Use the PivotChart tool (which will create a new worksheet), and name the new sheet "StillwaterEats. Fix the structural errors and determine the top three places to eat in Stillwater, OK according to the data. Provide your answer as a comment in cell B1. (4-points) 15. Highlight a survey question or questions in the data that use() each of the following scales of measurement: 3-points) a. Nominal highlight question() in green b. Ordinal - highlight questions() in blue Page 3 of 3 ZOOM + c. Ratio - highlight question (s) in red 16. Save your document as an xls or xlsx file and name it YourLastName.clean Page 1 of 3 ZOOM + Data Cleaning Assignment: Item (columns) Key: A. Response ID - Unique identifier generated by Qualtrics B. Duration - How long it took to finish the survey (in seconds) C. Recorded Date - Date and time the survey was completed D. Location Latitude - Latitude of respondent when taking the survey E. Location Longitude - Longitude of respondent when taking the survey F. "I am enrolled the following section" Section identifier G. Dog or cat person question multiple choice H. You or friend win money question - multiple choice I Risk aversion question - multiple choice 1. Day of the week question multiple choice K. Food question - multiple choice L. Social media question - multiple choice M. Duck Horse question multiple choice N. Hot dog question - true false question total o. Fight those that disagree question multiple choice (Likert scale) Highschool question - multiple choice (Likert scale) Q. Favorite Stillwater, OK restaurant - open response R. Favorite TV show- open response S. Academic %-percentage of time dedicated to academics - slider response T. Physical health %-percentage of time dedicated to physical health slider response U. Mental health % - percentage of time dedicated to mental health slider response V. Social family endeavors % - percentage of time to social and famil endeavors - slider response W. Preprofessional %-percentage of time dedicated to preprofessional activities slider response X. Average hours dedicated to school each week - open response Y. Salary expectation - open response Ranked section: How the respondent ranked Coldplay - drag and drop ranking AA How the respondent ranked U2 - drag and drop ranking . How the respondent ranked Dave Matthews Band drag and drop ranking AC. How the respondent ranked Radiohead - drag and drop ranking AD. How the respondent ranked Kanye West - drag and drop ranking AE. How the respondent ranked Black Eyed Peas - drag and drop ranking AF. How the respondent ranked Machine Gun Kelly - drag and drop ranking Z Page 2 of 3 ZOOM + Responses were collected from students enrolled in BADM 2233 via Qualtrics survey software online. Data were exported from the Qualtrics system in a CSV file and moved to Excel for cleaning. Please read the instructions carefully. Mistakes early in the process could prevent your success on later steps. 1. Copy the data from "Sheet 1" to a new worksheet, and title the new sheet Working (1- point) 2. Use the "Response ID" column to determine if there are any duplicate records. 3. Copy the remaining cases to a new worksheet, and title the new sheet "DuplicatesRemoved". (2-points) a. Determine the number of duplicate records that were removed, and provide that number as a comment in cell A1. 4. We want to exclude section 31979 from the analysis, so filter those individuals from the dataset. 5. Copy the remaining cases to a new worksheet, and title the new worksheet 31979Removed" (2-points) a. Determine the number of records that were removed through filtering, and provide that number as a comment in cell F1. 6. Insert a column after column W (Preprofessional %). Title this column "Total%".(1- point) 7. Enter a formula that calculates the sum of columns S:W for each row and copy that formula to the entire "Total%" column. (2-points) 8. cell X1 insert a comment that addresses how you would deal with values over 100% a (in column X) and why it is necessary to consider these values. (2-points) 9. Copy your data to a new worksheet, and title the new worksheet Errors". (1-point) 10. Sort your data by column B from largest to smallest. (1-point) 11. Insert a scatterplot for column B (Duration). Are there any obvious outliers in your data? Highlight those rows in yellow. (1-points) 12 How many empty cells are left in the data? Put your answer as a comment in cell A1. (1- point) 13. Use the Go To function to highlight those empty cells and paint them a shade of orange. Or use the find/replace and replace the blank with "-999". (1-point) cu 14. Check column Q for structural errors. Use the PivotChart tool (which will create a new worksheet), and name the new sheet "StillwaterEats. Fix the structural errors and determine the top three places to eat in Stillwater, OK according to the data. Provide your answer as a comment in cell B1. (4-points) 15. Highlight a survey question or questions in the data that use() each of the following scales of measurement: 3-points) a. Nominal highlight question() in green b. Ordinal - highlight questions() in blue Page 3 of 3 ZOOM + c. Ratio - highlight question (s) in red 16. Save your document as an xls or xlsx file and name it YourLastName.clean


 This is an excel data cleaning problem. I need help and it is due soon. All steps need to be done in excel.. Please show steps with pictures if possible! Anything will help!


