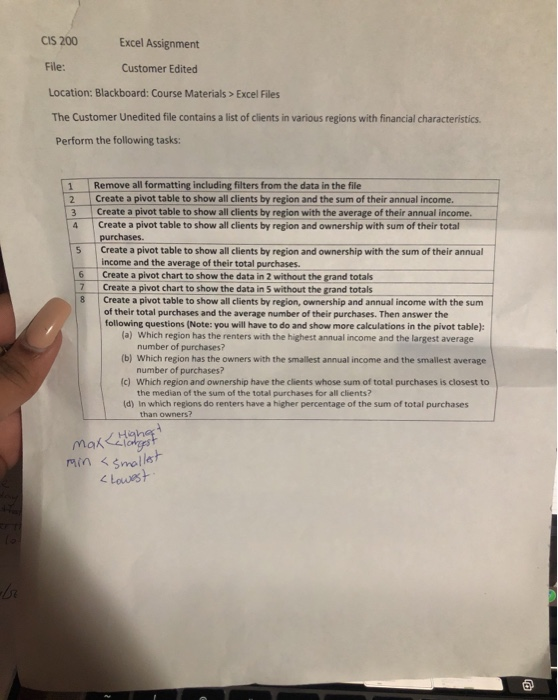
this is fhe file when i open it

CIS 200 Excel Assignment File: Customer Edited Location: Blackboard: Course Materials > Excel Files The Customer Unedited file contains a list of clients in various regions with financial characteristics. Perform the following tasks: 1 Remove all formatting including filters from the data in the file Create a pivot table to show all clients by region and the sum of their annual income. Create a pivot table to show all clients by region with the average of their annual income. Create a pivot table to show all clients by region and ownership with sum of their total purchases. Create a pivot table to show all clients by region and ownership with the sum of their annual Income and the average of their total purchases. Create a pivot chart to show the data in 2 without the grand totals Create a pivot chart to show the data in 5 without the grand totals Create a pivot table to show all clients by region, ownership and annual income with the sum of their total purchases and the average number of their purchases. Then answer the following questions (Note: you will have to do and show more calculations in the pivot table): (a) Which region has the renters with the highest annual income and the largest average number of purchases? (b) Which region has the owners with the smallest annual income and the smallest average number of purchases? (c) Which region and ownership have the clients whose sum of total purchases is closest to the median of the sum of the total purchases for all clients? (d) in which regions do renters have a higher percentage of the sum of total purchases than owners? Max Highg min
Excel Files The Customer Unedited file contains a list of clients in various regions with financial characteristics. Perform the following tasks: 1 Remove all formatting including filters from the data in the file Create a pivot table to show all clients by region and the sum of their annual income. Create a pivot table to show all clients by region with the average of their annual income. Create a pivot table to show all clients by region and ownership with sum of their total purchases. Create a pivot table to show all clients by region and ownership with the sum of their annual Income and the average of their total purchases. Create a pivot chart to show the data in 2 without the grand totals Create a pivot chart to show the data in 5 without the grand totals Create a pivot table to show all clients by region, ownership and annual income with the sum of their total purchases and the average number of their purchases. Then answer the following questions (Note: you will have to do and show more calculations in the pivot table): (a) Which region has the renters with the highest annual income and the largest average number of purchases? (b) Which region has the owners with the smallest annual income and the smallest average number of purchases? (c) Which region and ownership have the clients whose sum of total purchases is closest to the median of the sum of the total purchases for all clients? (d) in which regions do renters have a higher percentage of the sum of total purchases than owners? Max Highg min


