

Answered step by step
Verified Expert Solution
Question
1 Approved Answer
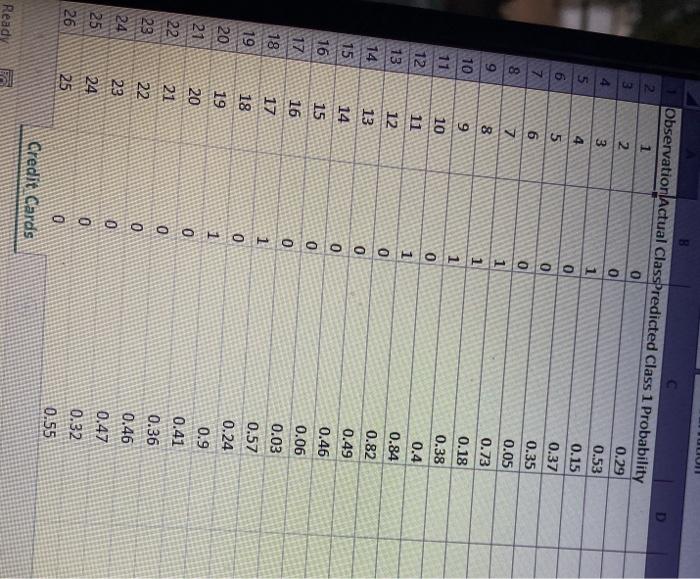
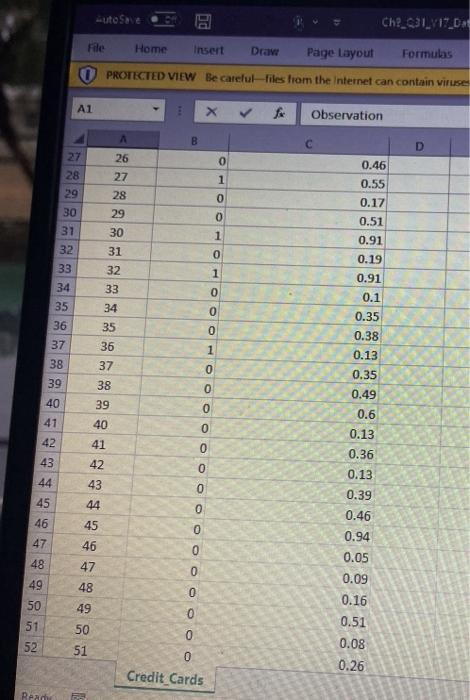
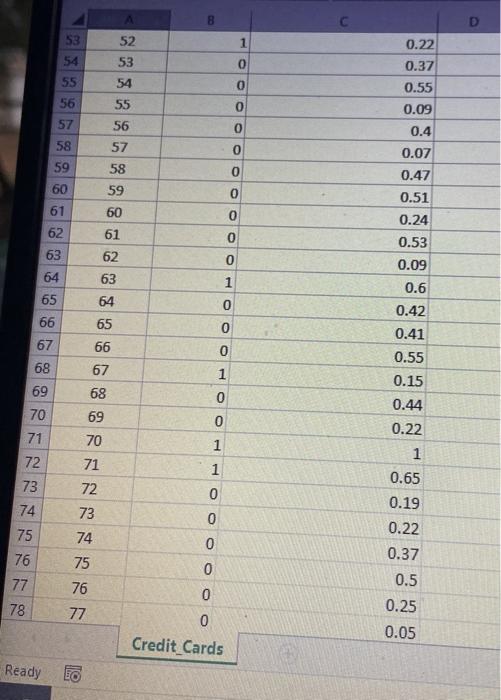
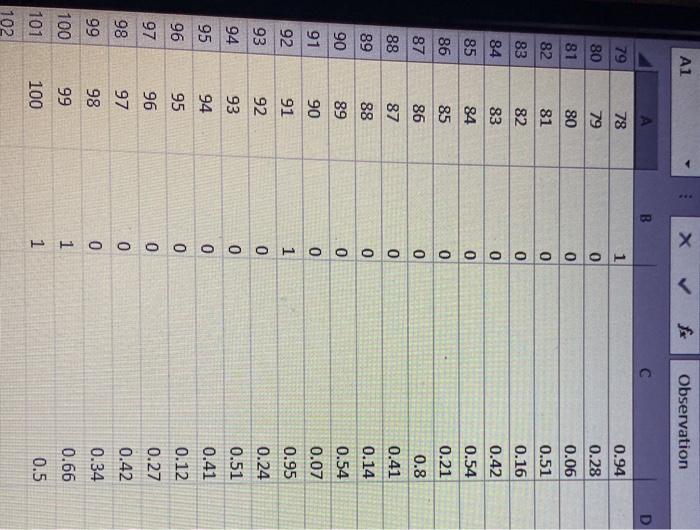
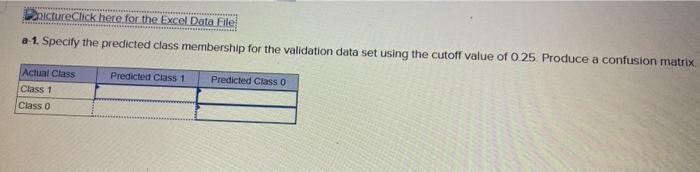
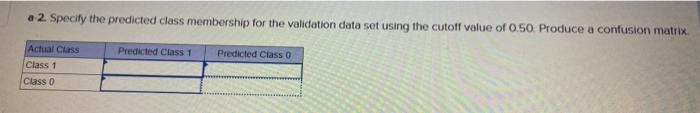
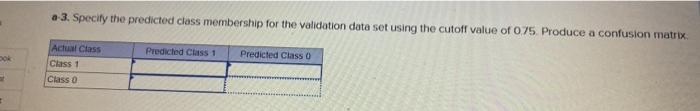
This is for business analytics TULUI 8 11 Observation Actual ClassPredicted Class 1 Probability C 1 2 0.29 0 4 0.53 3 1 0.15 4
This is for business analytics
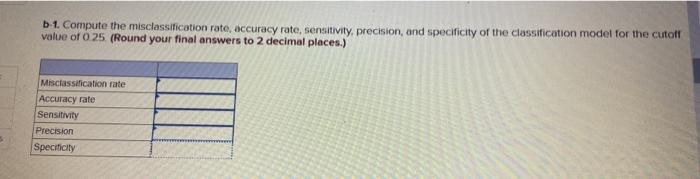
TULUI 8 11 Observation Actual ClassPredicted Class 1 Probability C 1 2 0.29 0 4 0.53 3 1 0.15 4 0 0.37 5 0 7 0.35 6 0 8 0.05 7 1 9 0.73 8 1 10 0.18 9 1 0.38 10 0 0.4 12 11 1 0.84 13 12 0 0.82 14 13 0 0.49 15 14 0 0.46 16 15 0 0.06 17 16 0 0.03 1 0.57 19 18 0 0.24 20 19 1 21 20 0.41 22 21 0 0.36 0 0.46 24 23 0 0.47 25 0 0.32 26 25 0 0.55 Credit Cards 18 17 0.9 0 22 Ready suto Se Ch?_31_17_n File Home Insert Drave Page Layout Formulas PROTECTED VIEW Be careful-Files from the Internet can contain viruse Al Observation A D 0 27 28 29 26 27 1 0.46 0.55 0.17 0 28 29 30 0 31 30 1 0.51 0.91 0.19 31 0 32 33 34 32 1 33 0 35 0 36 34 35 36 0 0.91 0.1 0.35 0.38 0.13 0.35 0.49 37 1 38 37 0 39 0 38 39 40 0 41 40 0 0.6 0.13 0.36 42 41 0 43 42 0 0.13 44 43 0 0.39 45 44 0 45 0 46 47 48 0 46 47 48 0 49 0 0.46 0.94 0.05 0.09 0.16 0.51 0.08 0.26 50 49 0 51 50 0 52 51 0 Credit Cards Read 52 1 0 53 54 55 56 0 0 57 0 53 54 55 56 57 58 59 60 0 58 59 60 0 0 61 0 0 62 63 0.22 0.37 0.55 0.09 0.4 0.07 0.47 0.51 0.24 0.53 0.09 0.6 0.42 0.41 0.55 0.15 0.44 0.22 0 64 61 62 63 64 65 66 1 0 0 65 66 67 68 0 67 68 69 70 1 0 69 0 71 70 1 1 1 72 73 71 72 73 0 0 74 74 75 76 77 0 75 76 0.65 0.19 0.22 0.37 0.5 0.25 0.05 0 0 78 77 0 Credit Cards Ready A1 Observation B D 79 78 1 0 0.94 0.28 79 80 81 80 0 0.06 82 81 o 0.51 83 82 0 84 83 0 85 84 0 0.16 0.42 0.54 0.21 0.8 86 85 0 86 87 88 0 0 87 0.41 0.14 89 88 0 90 0 89 90 0.54 0.07 91 0 92 91 1 93 92 0 94 93 0 0.95 0.24 0.51 0.41 0.12 95 0 94 95 96 0 97 0 0.27 96 97 98 0 0.42 0.34 99 98 0 99 1 0.66 100 101 100 1 0.5 102 pictureClick here for the Excel Data File a 1. Specify the predicted class membership for the validation data set using the cutoff value of 0.25. Produce a confusion matrix Predicted Class 1 Predicted Class o Actual Class Class 1 Class o a 2. Specify the predicted class membership for the validation data set using the cutoff value of 0.50 Produce a confusion matrix Predicted Class 1 Predicted Class o Actual Class Class 1 Class o a 3. Specify the predicted class membership for the validation data set using the cutoff value of 075. Produce a confusion matrix Predicted Class 1 Predicted Class 0 Actual Class Class 1 Class o -1. Compute the misclassification rate, accuracy rate, sensitivity, precision, and specificity of the classification model for the cutoff value of 0 25 (Round your final answers to 2 decimal places.) Misclassification rate Accuracy rate Sensitivity Precision Specificity 5 TULUI 8 11 Observation Actual ClassPredicted Class 1 Probability C 1 2 0.29 0 4 0.53 3 1 0.15 4 0 0.37 5 0 7 0.35 6 0 8 0.05 7 1 9 0.73 8 1 10 0.18 9 1 0.38 10 0 0.4 12 11 1 0.84 13 12 0 0.82 14 13 0 0.49 15 14 0 0.46 16 15 0 0.06 17 16 0 0.03 1 0.57 19 18 0 0.24 20 19 1 21 20 0.41 22 21 0 0.36 0 0.46 24 23 0 0.47 25 0 0.32 26 25 0 0.55 Credit Cards 18 17 0.9 0 22 Ready suto Se Ch?_31_17_n File Home Insert Drave Page Layout Formulas PROTECTED VIEW Be careful-Files from the Internet can contain viruse Al Observation A D 0 27 28 29 26 27 1 0.46 0.55 0.17 0 28 29 30 0 31 30 1 0.51 0.91 0.19 31 0 32 33 34 32 1 33 0 35 0 36 34 35 36 0 0.91 0.1 0.35 0.38 0.13 0.35 0.49 37 1 38 37 0 39 0 38 39 40 0 41 40 0 0.6 0.13 0.36 42 41 0 43 42 0 0.13 44 43 0 0.39 45 44 0 45 0 46 47 48 0 46 47 48 0 49 0 0.46 0.94 0.05 0.09 0.16 0.51 0.08 0.26 50 49 0 51 50 0 52 51 0 Credit Cards Read 52 1 0 53 54 55 56 0 0 57 0 53 54 55 56 57 58 59 60 0 58 59 60 0 0 61 0 0 62 63 0.22 0.37 0.55 0.09 0.4 0.07 0.47 0.51 0.24 0.53 0.09 0.6 0.42 0.41 0.55 0.15 0.44 0.22 0 64 61 62 63 64 65 66 1 0 0 65 66 67 68 0 67 68 69 70 1 0 69 0 71 70 1 1 1 72 73 71 72 73 0 0 74 74 75 76 77 0 75 76 0.65 0.19 0.22 0.37 0.5 0.25 0.05 0 0 78 77 0 Credit Cards Ready A1 Observation B D 79 78 1 0 0.94 0.28 79 80 81 80 0 0.06 82 81 o 0.51 83 82 0 84 83 0 85 84 0 0.16 0.42 0.54 0.21 0.8 86 85 0 86 87 88 0 0 87 0.41 0.14 89 88 0 90 0 89 90 0.54 0.07 91 0 92 91 1 93 92 0 94 93 0 0.95 0.24 0.51 0.41 0.12 95 0 94 95 96 0 97 0 0.27 96 97 98 0 0.42 0.34 99 98 0 99 1 0.66 100 101 100 1 0.5 102 pictureClick here for the Excel Data File a 1. Specify the predicted class membership for the validation data set using the cutoff value of 0.25. Produce a confusion matrix Predicted Class 1 Predicted Class o Actual Class Class 1 Class o a 2. Specify the predicted class membership for the validation data set using the cutoff value of 0.50 Produce a confusion matrix Predicted Class 1 Predicted Class o Actual Class Class 1 Class o a 3. Specify the predicted class membership for the validation data set using the cutoff value of 075. Produce a confusion matrix Predicted Class 1 Predicted Class 0 Actual Class Class 1 Class o -1. Compute the misclassification rate, accuracy rate, sensitivity, precision, and specificity of the classification model for the cutoff value of 0 25 (Round your final answers to 2 decimal places.) Misclassification rate Accuracy rate Sensitivity Precision Specificity 5 Step by Step Solution
There are 3 Steps involved in it
Step: 1

Get Instant Access to Expert-Tailored Solutions
See step-by-step solutions with expert insights and AI powered tools for academic success
Step: 2

Step: 3
Ace Your Homework with AI
Get the answers you need in no time with our AI-driven, step-by-step assistance
Get Started
Finance And Democracy Towards A Sustainable Financial System
Authors: Alessandro Vercelli
1st Edition
3030279111, 978-3030279110