This is from my study guide I'm not sure how to anwser these questions using excel.
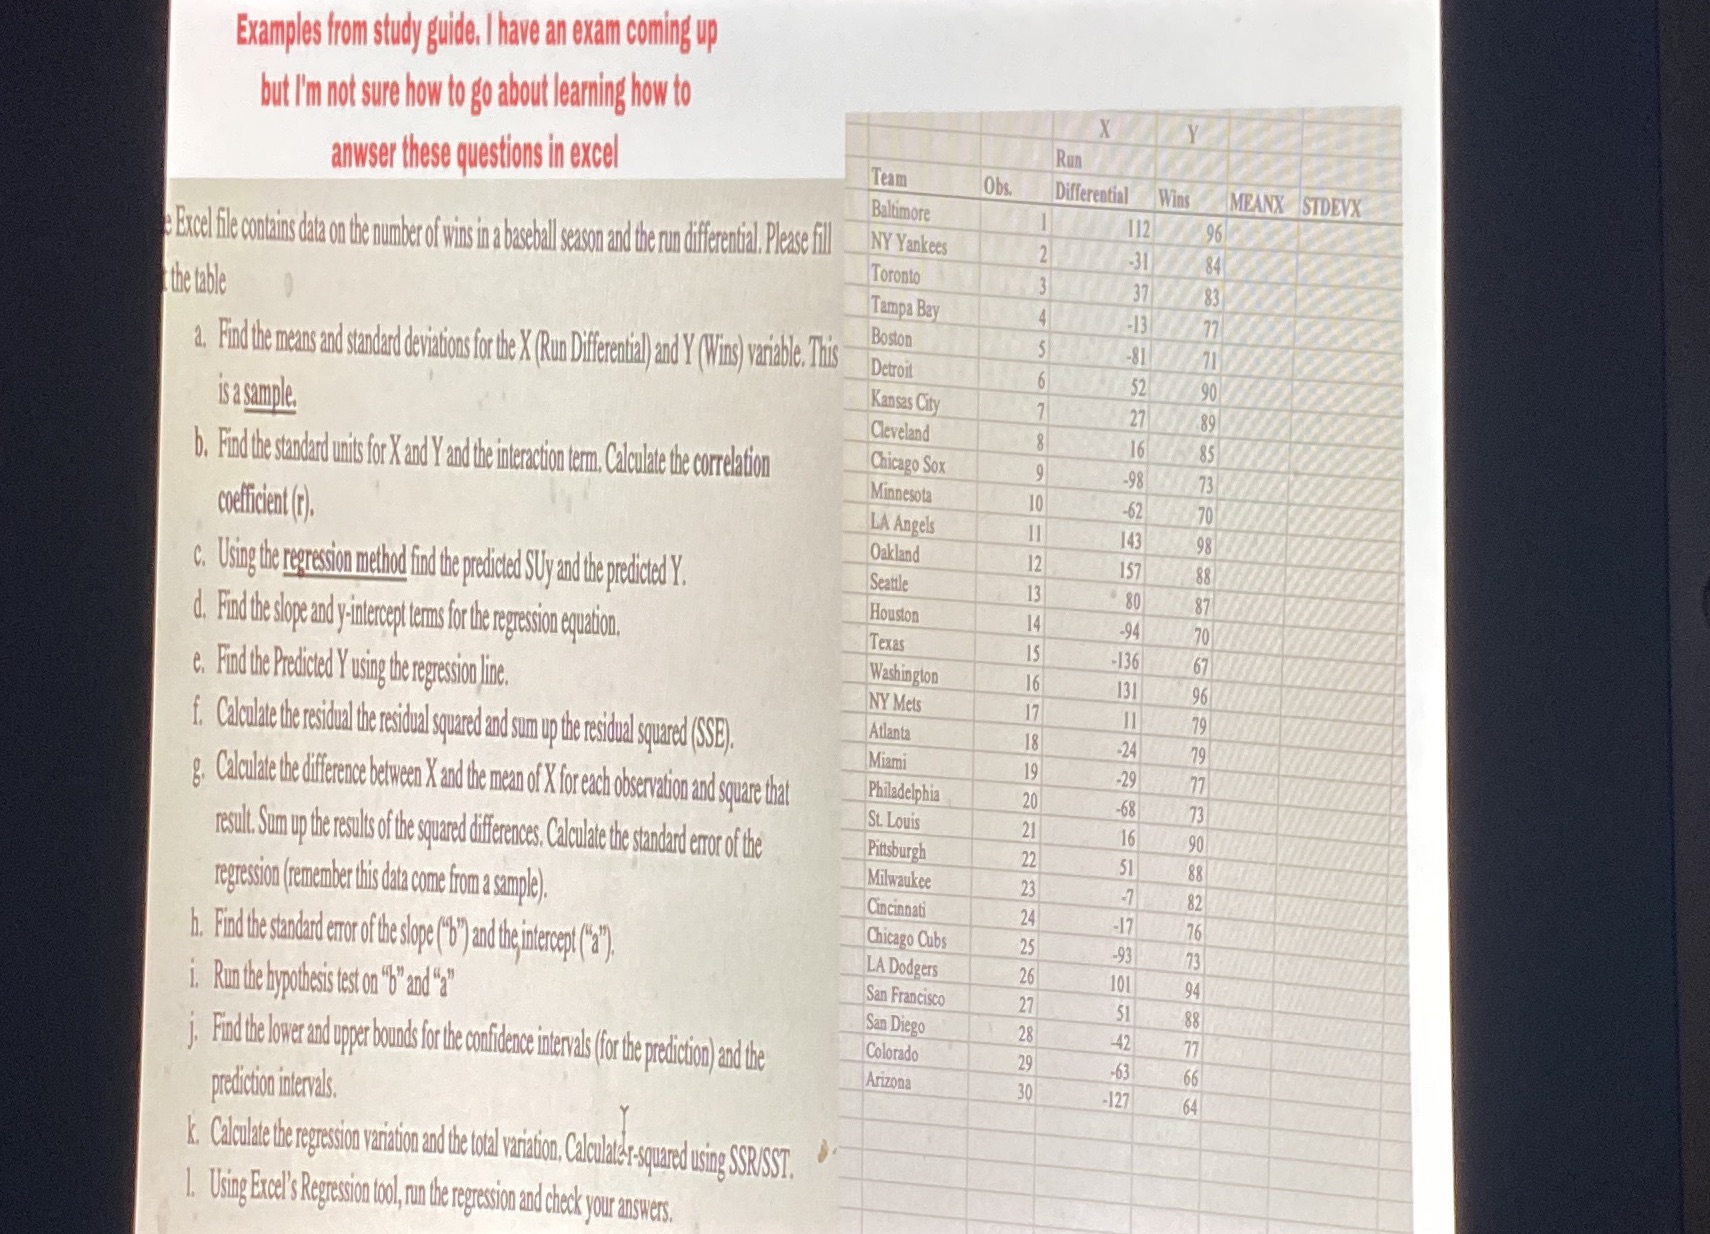
Examples from study guide, I have an exam coming up but I'm not sure how to go about learning how to Run anwser these questions in excel Team Obs Differential Wins MEANX STDEVX Baltimore 112 96 e Excel file contains data on the number of wins in a baseball season and the run differential, Please fil NY Yankees 2 -31 84 Toronto 3 37 83 the table Tampa Bay 4 -13 Boston a. Find the means and standard deviations for the X (Run Differential) and Y (Wins) variable. This -81 Detroit 6 $290 Kansas City 7 27 is a sample. Cleveland 8 16 b. Find the standard units for X and Y and the interaction term, Calculate the correlation Chicago Sox 9 -98 Minnesota 10 -62 coefficient (r). LA Angels 11 143 Oakland 12 157 C. Using the regression method find the predicted SUy and the predicted Y. Seattle 13 80 Houston 14 -94 d. Find the slope and y intercept terms for the regression equation. Texas 15 -136 Washington e. Find the Predicted Y using the regression line. 16 131 NY Mets 17 11 f. Calculate the residual the residual squared and sum up the residual squared (SSE). Atlanta 18 -24 Miami 19 -29 8. Calculate the difference between X and the mean of X for each observation and square that Philadelphia 20 -68 St. Louis 21 16 result. Sum up the results of the squared differences. Calculate the standard error of the Pittsburgh 22 51 Milwaukee 23 -7 regression (remember this data come from a sample). Cincinnati 24 -17 h. Find the standard error of the slope ("b") and the intercept ("a"). Chicago Cubs -93 LA Dodgers 26 101 94 i. Run the hypothesis test on "b" and "?" San Francisco 27 51 88 San Diego 28 42 j. Find the lower and upper bounds for the confidence intervals (for the prediction) and the Colorado 29 -63 Arizona -127 64 prediction intervals. K. Calculate the regression variation and the total variation, Calculator-squared using SSRISST. 1. Using Excel's Regression tool, run the regression and check your answers