Answered step by step
Verified Expert Solution
Question
1 Approved Answer
This is on Amazon Risk Analysis and Pricing Next you'll analyze the risk of the firm to estimate an appropriate discount rate. The discount rate


This is on Amazon
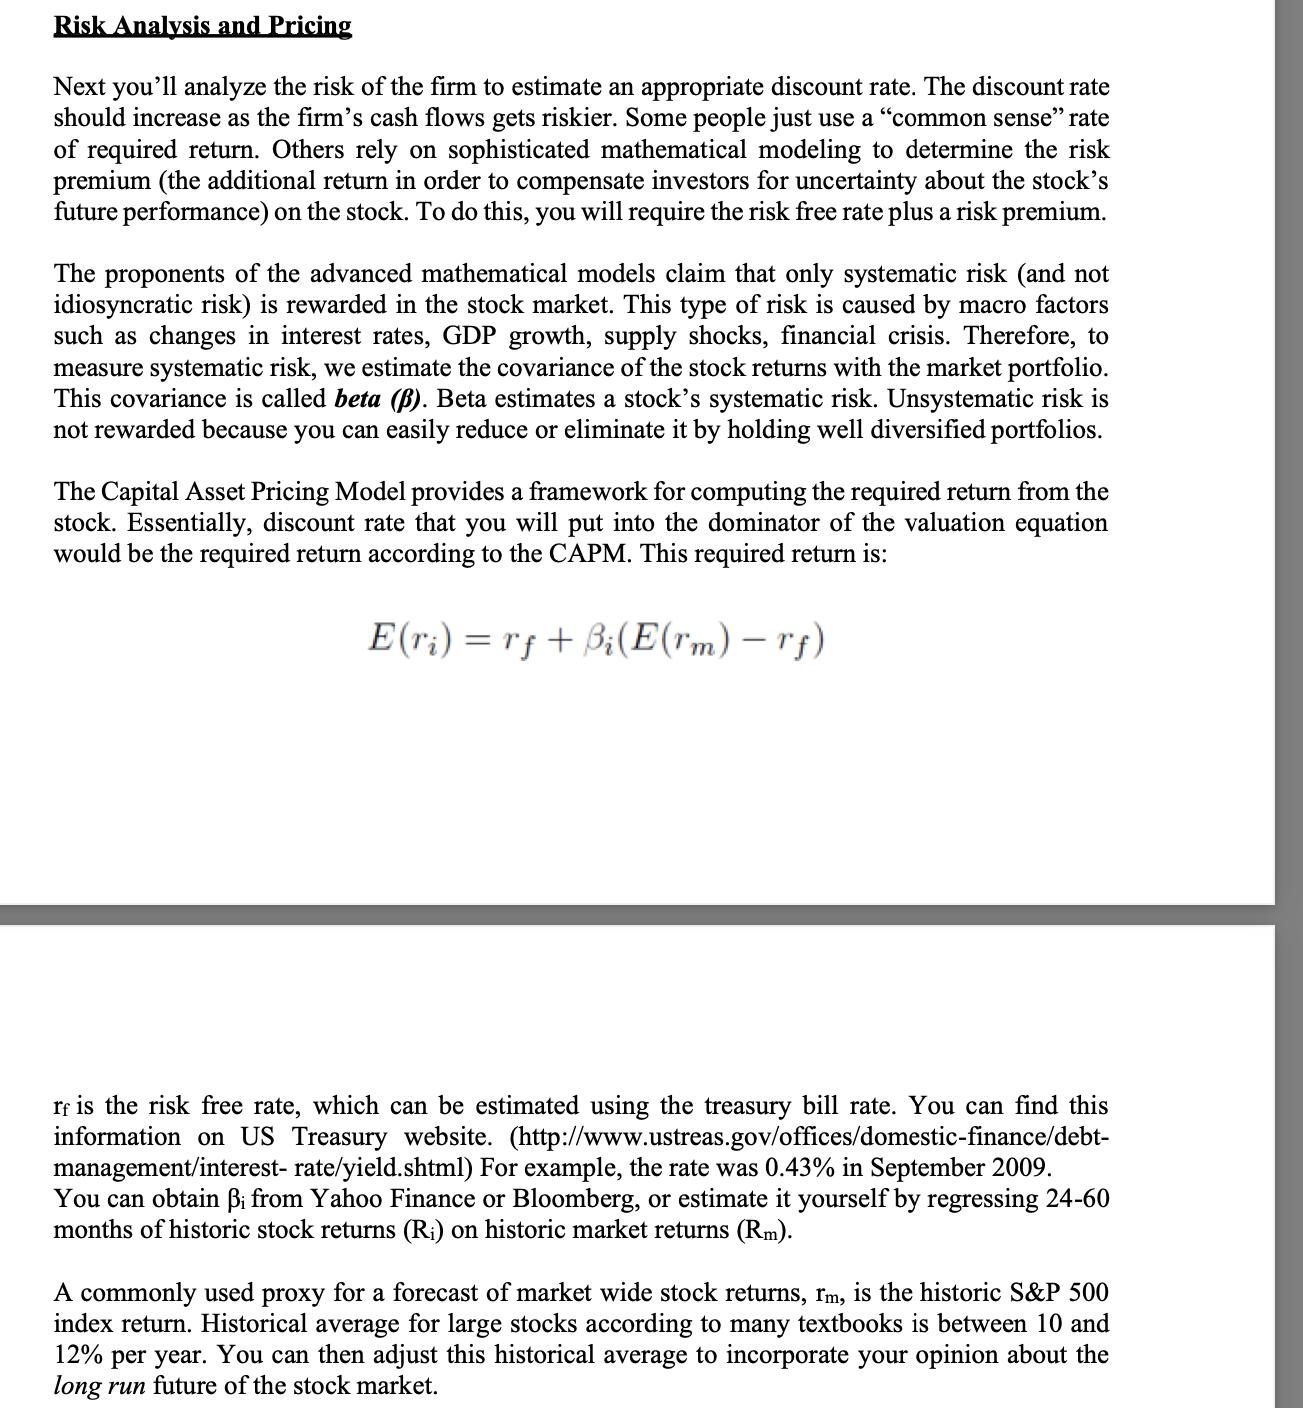
Risk Analysis and Pricing Next you'll analyze the risk of the firm to estimate an appropriate discount rate. The discount rate should increase as the firm's cash flows gets riskier. Some people just use a "common sense" rate of required return. Others rely on sophisticated mathematical modeling to determine the risk premium (the additional return in order to compensate investors for uncertainty about the stock's future performance) on the stock. To do this, you will require the risk free rate plus a risk premium. The proponents of the advanced mathematical models claim that only systematic risk (and not idiosyncratic risk) is rewarded in the stock market. This type of risk is caused by macro factors such as changes in interest rates, GDP growth, supply shocks, financial crisis. Therefore, to measure systematic risk, we estimate the covariance of the stock returns with the market portfolio. This covariance is called beta (B). Beta estimates a stock's systematic risk. Unsystematic risk is not rewarded because you can easily reduce or eliminate it by holding well diversified portfolios. The Capital Asset Pricing Model provides a framework for computing the required return from the stock. Essentially, discount rate that you will put into the dominator of the valuation equation would be the required return according to the CAPM. This required return is: E(ri) rf+Bi(E(rm) - r) rf is the risk free rate, which can be estimated using the treasury bill rate. You can find this information on US Treasury website. (http://www.ustreas.gov/offices/domestic-finance/debt- management/interest-rate/yield.shtml) For example, the rate was 0.43% in September 2009. You can obtain i from Yahoo Finance or Bloomberg, or estimate it yourself by regressing 24-60 months of historic stock returns (Ri) on historic market returns (Rm). A commonly used proxy for a forecast of market wide stock returns, rm, is the historic S&P 500 index return. Historical average for large stocks according to many textbooks is between 10 and 12% per year. You can then adjust this historical average to incorporate your opinion about the long run future of the stock market.
Step by Step Solution
There are 3 Steps involved in it
Step: 1

Get Instant Access to Expert-Tailored Solutions
See step-by-step solutions with expert insights and AI powered tools for academic success
Step: 2

Step: 3

Ace Your Homework with AI
Get the answers you need in no time with our AI-driven, step-by-step assistance
Get Started


