 This is R-program question!
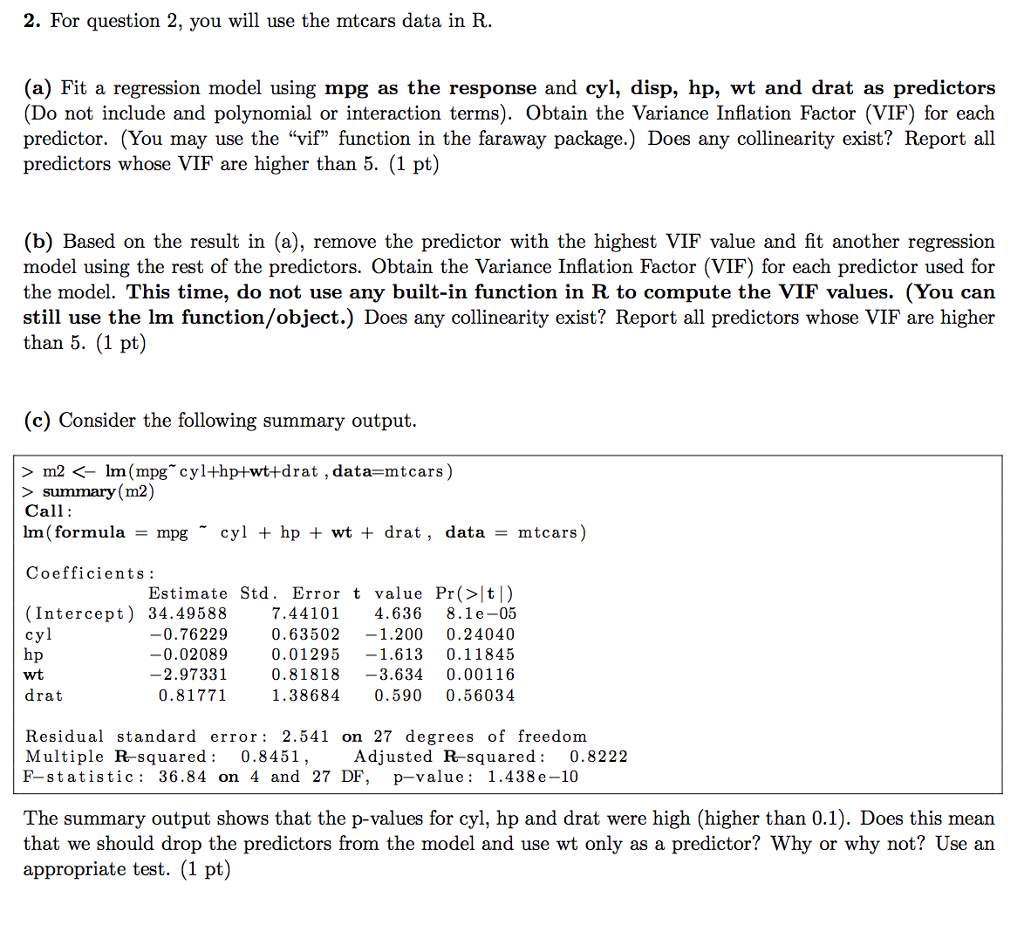
2. For question 2, you will use the mtcars data in R. (a) Fit a regression model using mpg as the response and cyl, disp, hp, wt and drat as predictors (Do not include and polynomial or interaction terms). Obtain the Variance Inflation Factor (VIF) for each predictor. (You may use the "vif" function in the faraway package.) Does any collinearity exist? Report all predictors whose VIF are higher than 5. (1 pt) (b) Based on the result in (a), remove the predictor with the highest VIF value and fit another regression model using the rest of the predictors. Obtain the Variance Inflation Factor (VIF) for each predictor used for the model. This time, do not use any built-in function in R to compute the VIF values. (You can still use the lm function/object.) Does any collinearity exist? Report all predictors whose VIF are higher than 5. (1 pt) (c) Consider the following summary output. > m2 summary(m2) Call: Im (formula mpg cyl + hp + wt + drat, data mtcars) Coefficients: Estimate Std. Error t value Pr(> t|) (Intercept) 34.49588 7.44101 4.636 8.1e-05 1.200 0.24040 1.613 0.11845 3.634 0.00116 1.38684 0.5900.56034 -0.76229 0.02089 2.97331 0.81771 0.63502 0.01295 0.81818 wt ra Residual standard error: 2.541 on 27 degrees of freedom Multiple R-squared: 0.8451, F-statistic: 36.84 on 4 and 27 DF, p-value: 1.438 e-10 Adjusted R-squared:0.8222 The summary output shows that the p-values for cyl, hp and drat were high (higher than 0.1). Does this mean that we should drop the predictors from the model and use wt only as a predictor? Why or why not? Use an appropriate test. (1 pt) 2. For question 2, you will use the mtcars data in R. (a) Fit a regression model using mpg as the response and cyl, disp, hp, wt and drat as predictors (Do not include and polynomial or interaction terms). Obtain the Variance Inflation Factor (VIF) for each predictor. (You may use the "vif" function in the faraway package.) Does any collinearity exist? Report all predictors whose VIF are higher than 5. (1 pt) (b) Based on the result in (a), remove the predictor with the highest VIF value and fit another regression model using the rest of the predictors. Obtain the Variance Inflation Factor (VIF) for each predictor used for the model. This time, do not use any built-in function in R to compute the VIF values. (You can still use the lm function/object.) Does any collinearity exist? Report all predictors whose VIF are higher than 5. (1 pt) (c) Consider the following summary output. > m2 summary(m2) Call: Im (formula mpg cyl + hp + wt + drat, data mtcars) Coefficients: Estimate Std. Error t value Pr(> t|) (Intercept) 34.49588 7.44101 4.636 8.1e-05 1.200 0.24040 1.613 0.11845 3.634 0.00116 1.38684 0.5900.56034 -0.76229 0.02089 2.97331 0.81771 0.63502 0.01295 0.81818 wt ra Residual standard error: 2.541 on 27 degrees of freedom Multiple R-squared: 0.8451, F-statistic: 36.84 on 4 and 27 DF, p-value: 1.438 e-10 Adjusted R-squared:0.8222 The summary output shows that the p-values for cyl, hp and drat were high (higher than 0.1). Does this mean that we should drop the predictors from the model and use wt only as a predictor? Why or why not? Use an appropriate test. (1 pt)