This is statistics course and I need help with answering those questions. If you don't have much time to provide solutions, that's fine but I need correct answers asap. Thank you
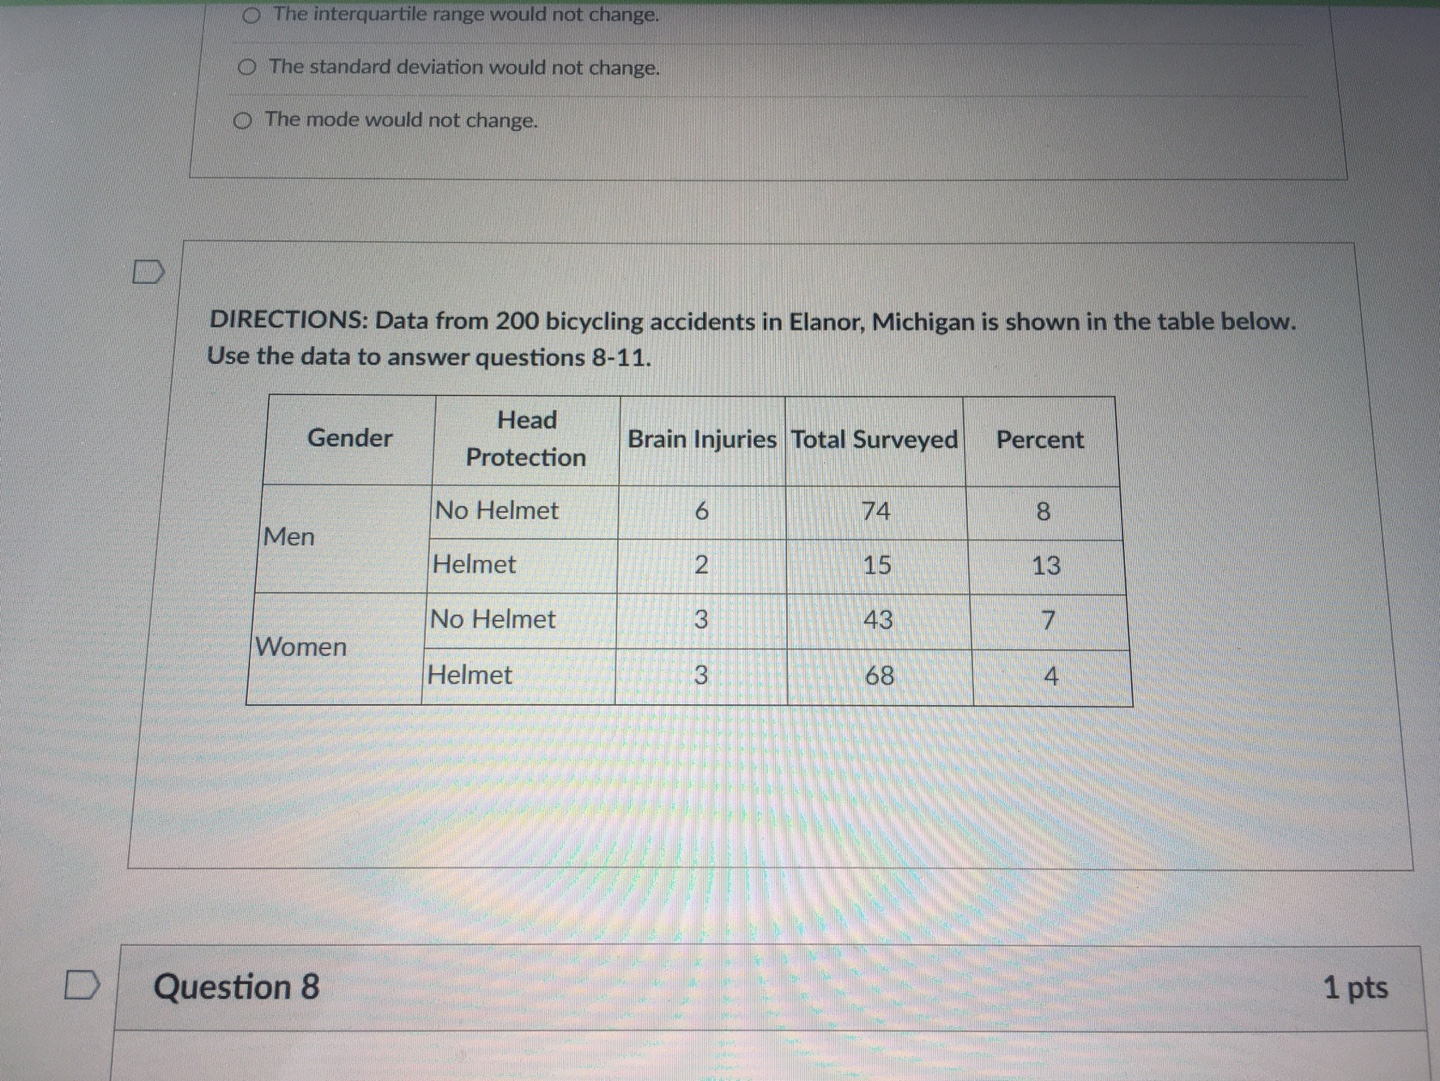
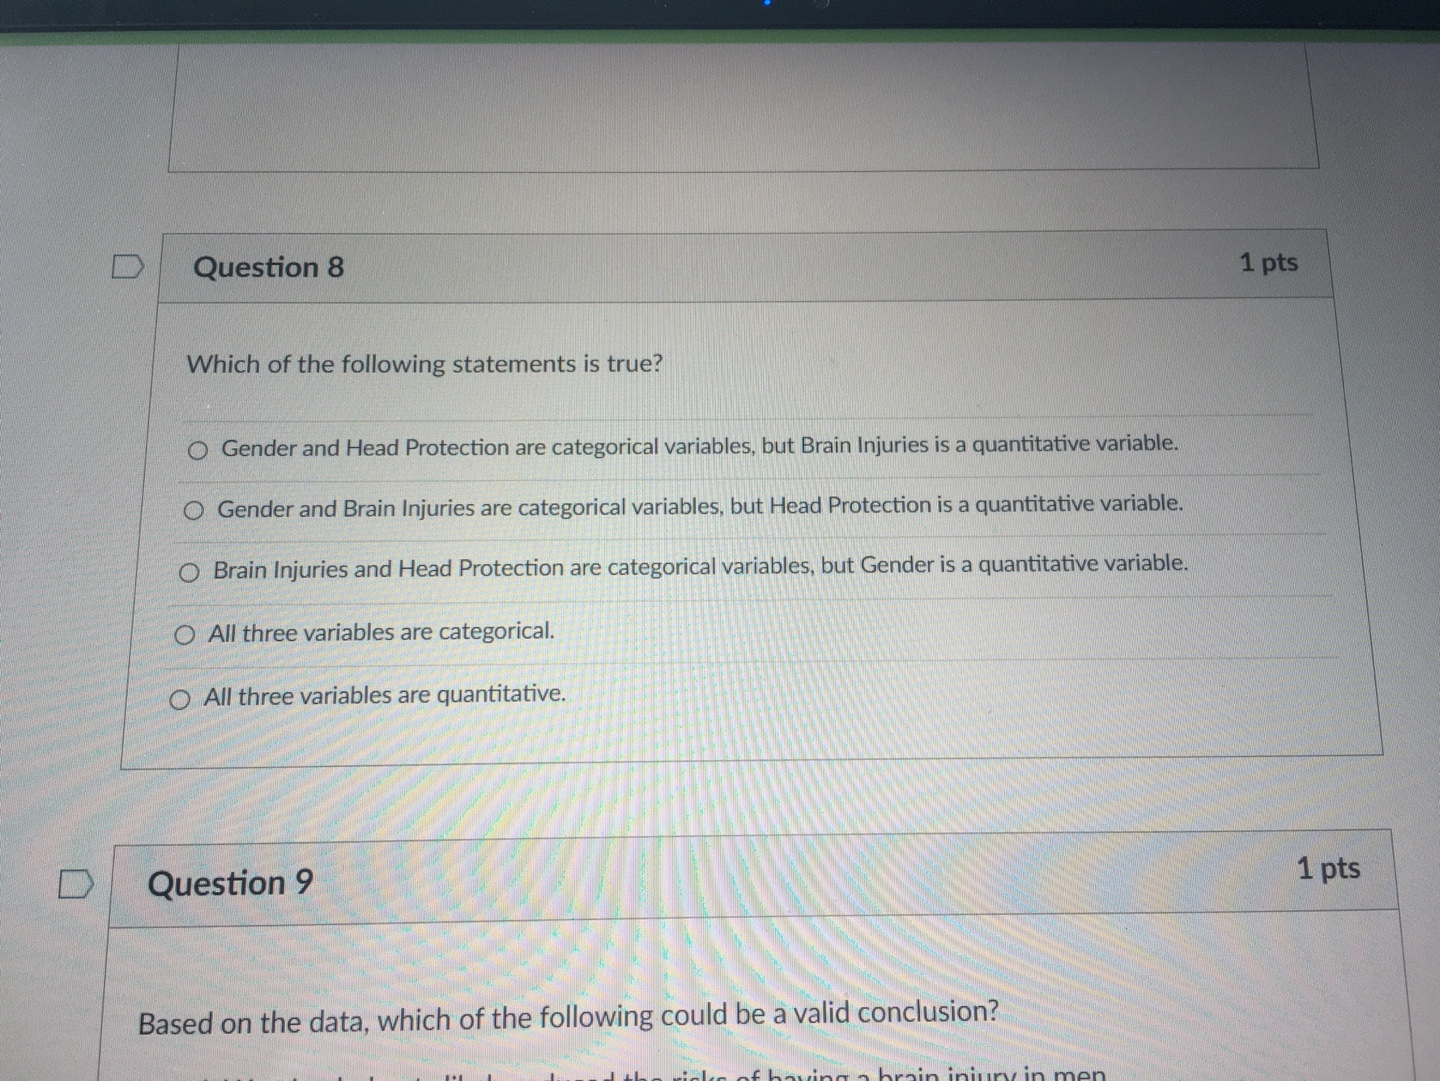
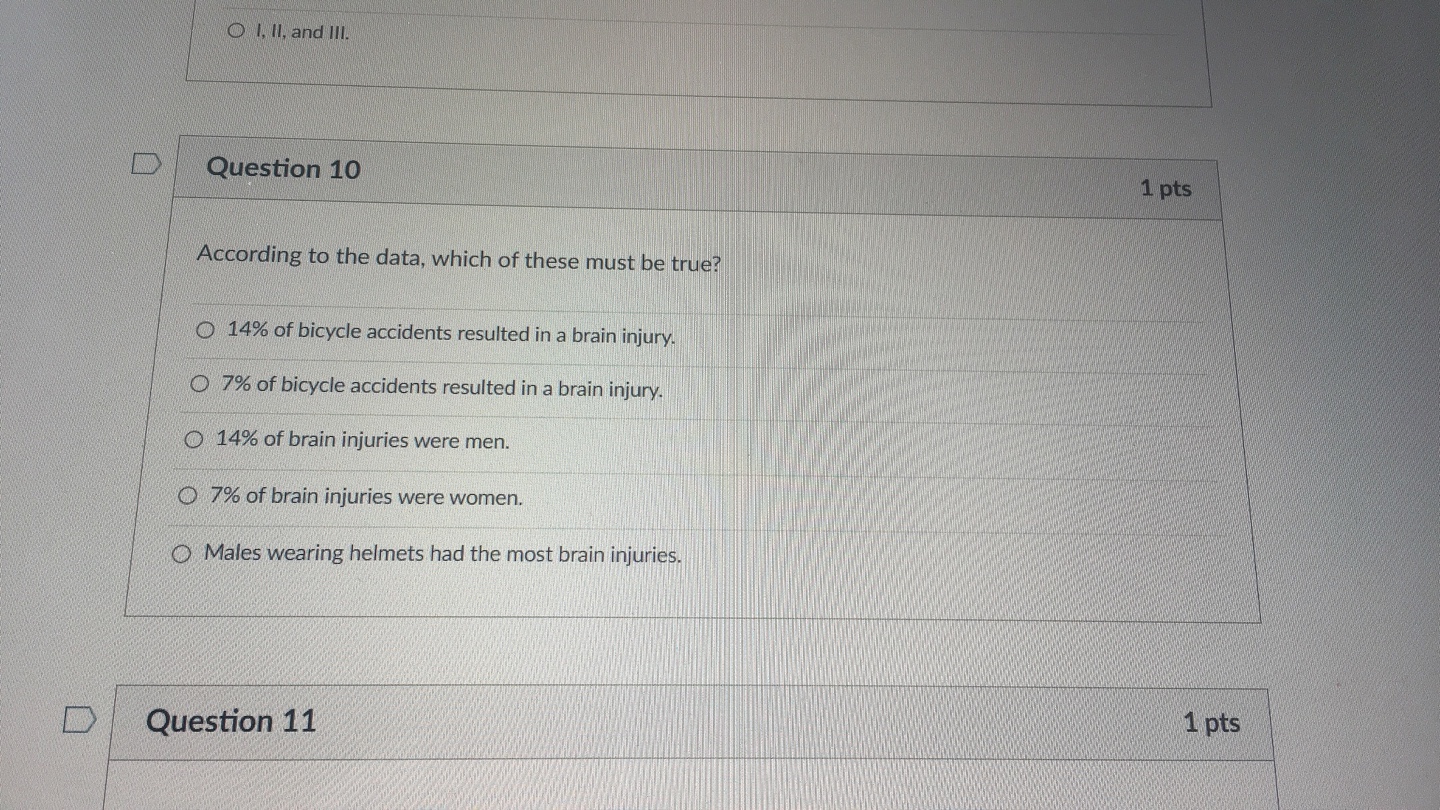
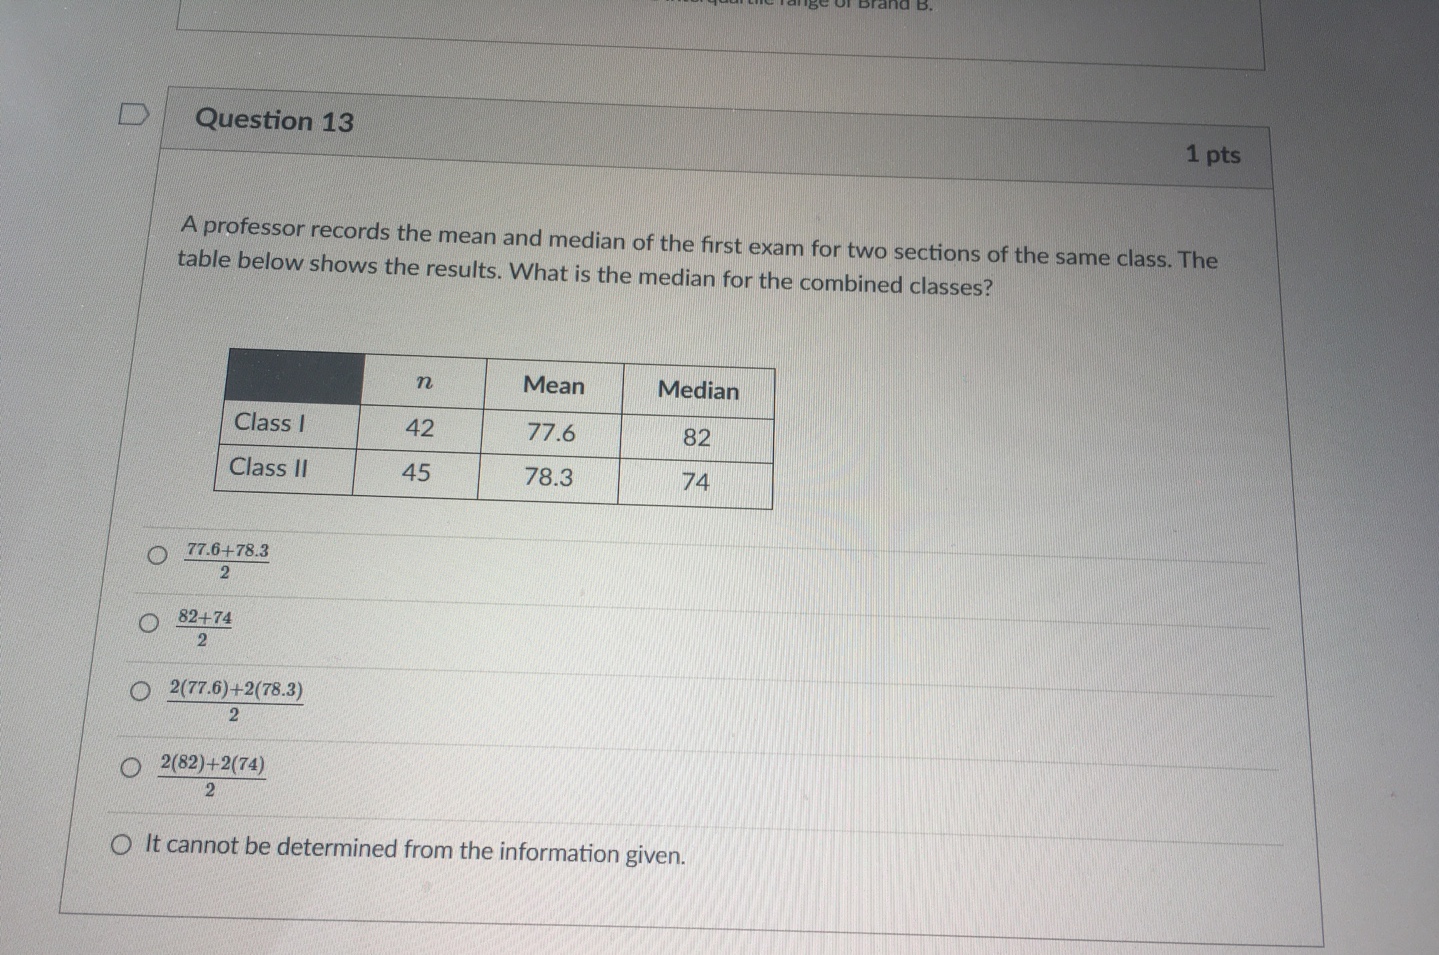
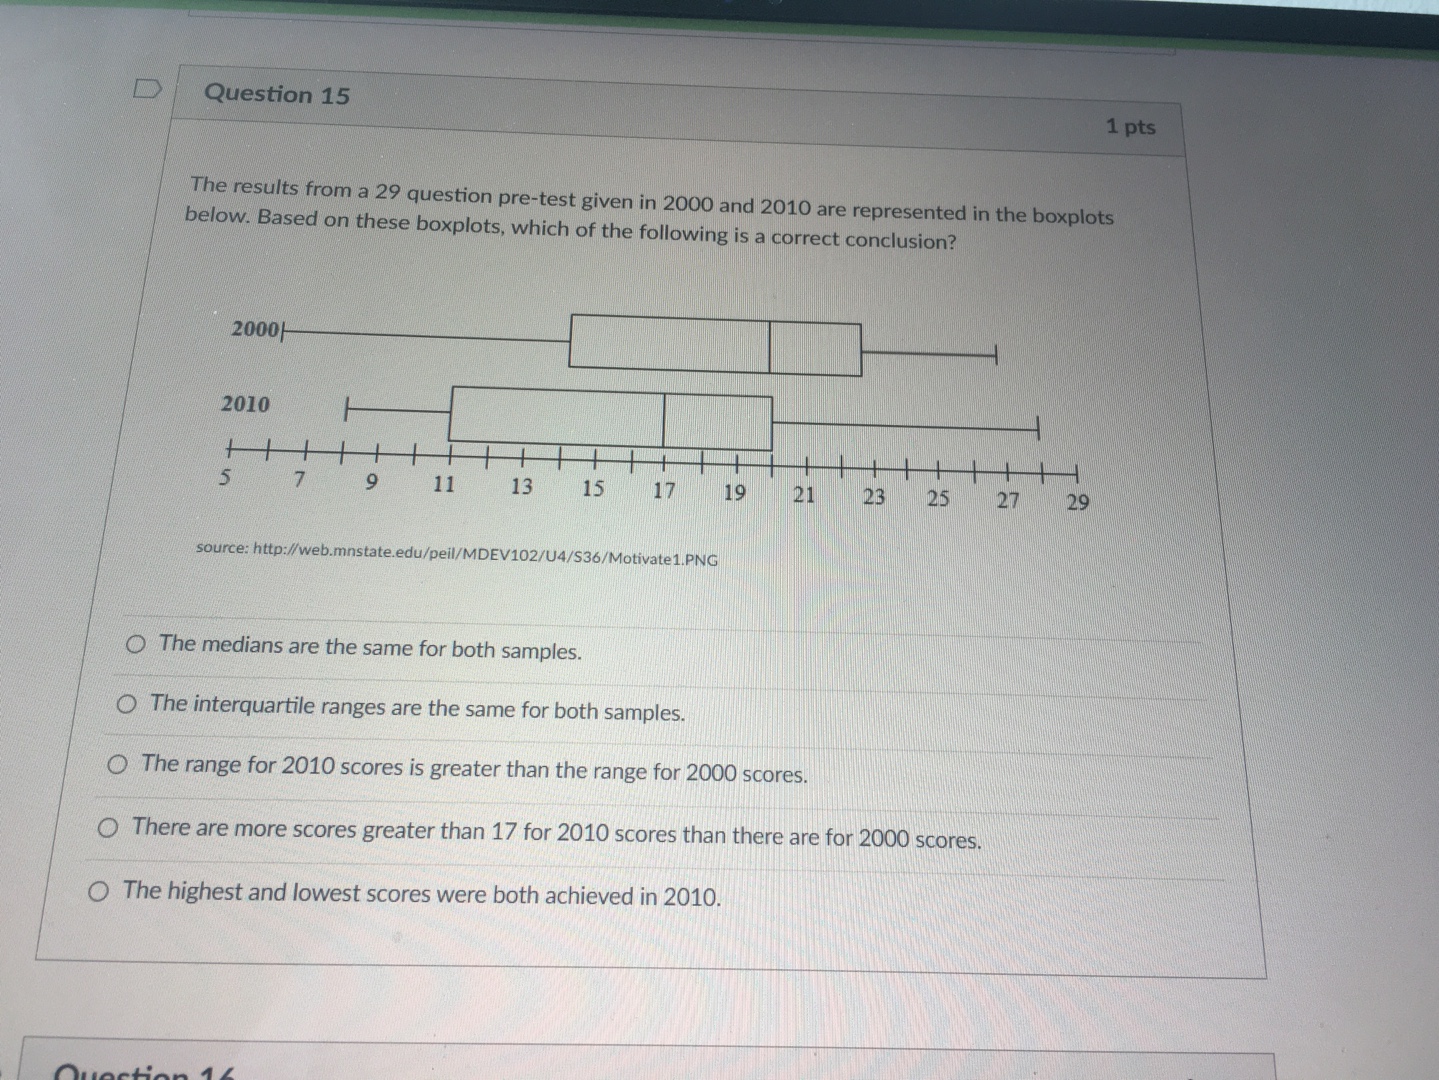
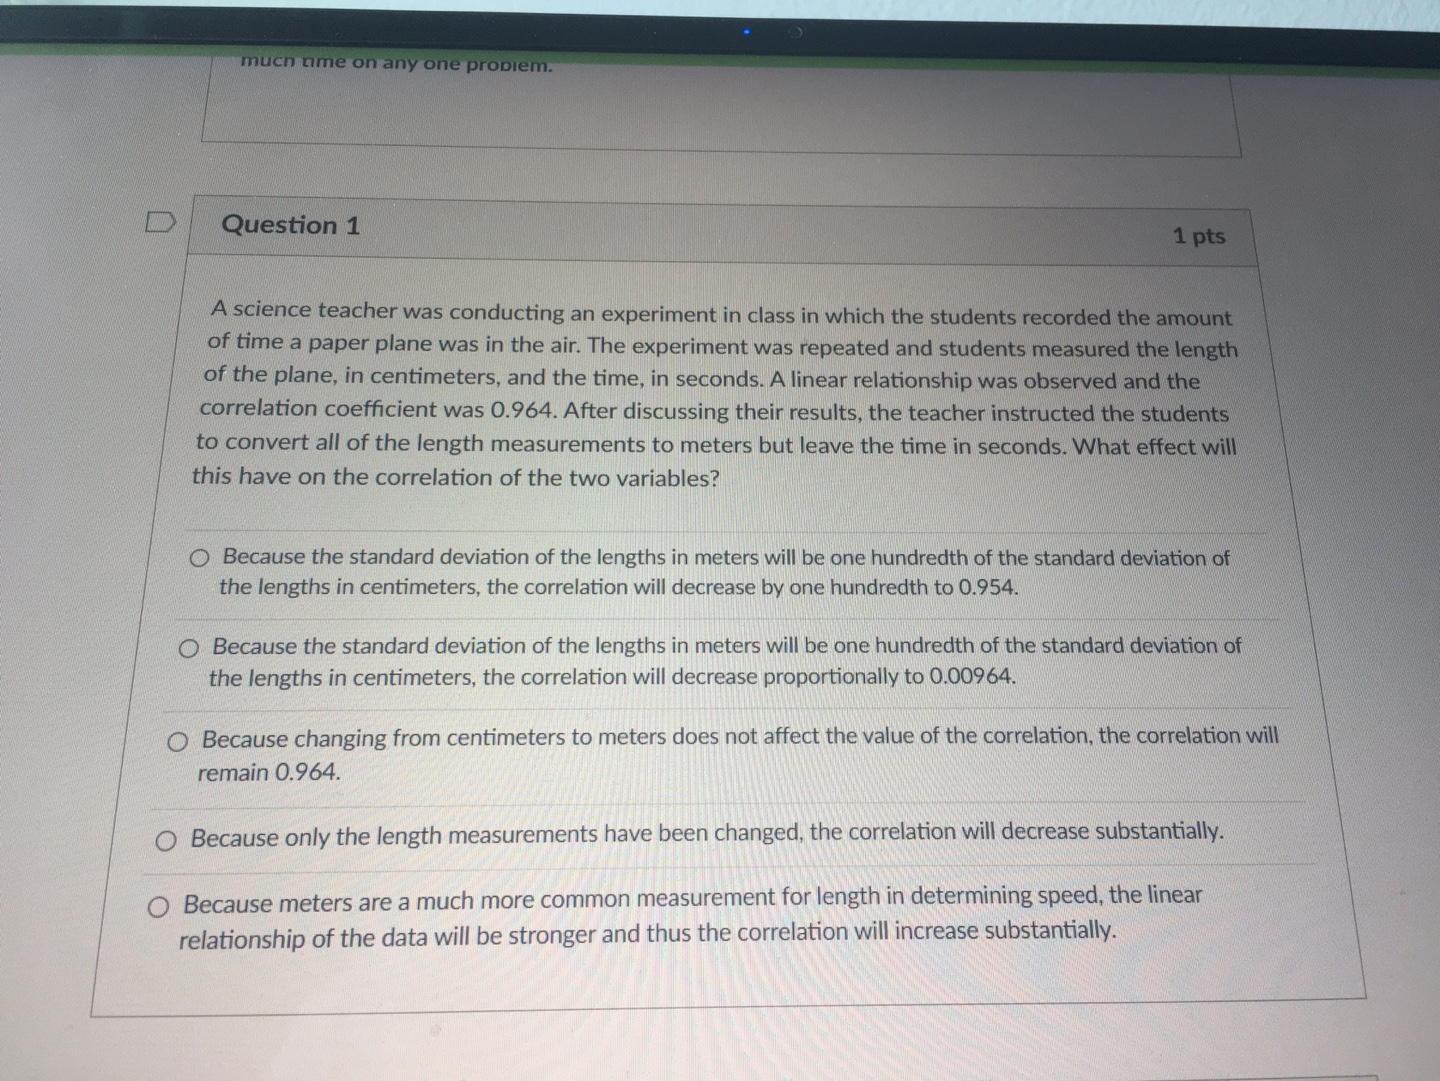
The interquartile range would not change. The standard deviation would not change. The mode would not change. DIRECTIONS: Data from 200 bicycling accidents in Elanor, Michigan is shown in the table below. Use the data to answer questions 8-11. Head Gender Brain Injuries Total Surveyed Percent Protection No Helmet 6 74 8 Men Helmet 2 15 13 No Helmet 3 43 7 Women Helmet 3 68 4 D Question 8 1 ptsQuestion 8 1 pts Which of the following statements is true? Gender and Head Protection are categorical variables, but Brain Injuries is a quantitative variable. Gender and Brain Injuries are categorical variables, but Head Protection is a quantitative variable. Brain Injuries and Head Protection are categorical variables, but Gender is a quantitative variable. O All three variables are categorical. All three variables are quantitative. D Question 9 1 pts Based on the data, which of the following could be a valid conclusion?D Question 9 1 pts Based on the data, which of the following could be a valid conclusion? 1. Wearing helmets likely reduced the risks of having a brain injury in men. II. Wearing helmets likely reduced the risks of having a brain injury in women. Ill. Women cyclists are more likely to wear helmets than men cyclists. O I only O II only O I and III O ll and III O I, II, and Ill. D Question 10 1 ptsO I, Il, and Ill. Question 10 1 pts According to the data, which of these must be true? 14% of bicycle accidents resulted in a brain injury. 7% of bicycle accidents resulted in a brain injury. 14% of brain injuries were men. 7% of brain injuries were women. Males wearing helmets had the most brain injuries. D Question 11 1 pts14% of brain injuries were men. 7% of brain injuries were women. Males wearing helmets had the most brain injuries. D Question 11 1 pts To gather the data, a government agency used police records for all the bicycle accidents that were reported to the Elanor Police Department during the 1990s and 2000s. Which of these best describes the method of data collection? Census Sample survey Experiment Observational study Blind research assignment D Question 12 1 ptsD Question 13 1 pts A professor records the mean and median of the first exam for two sections of the same class. The table below shows the results. What is the median for the combined classes? n Mean Median Class I 42 77.6 82 Class Il 45 78.3 74 77.6+78.3 2 O 82+74 2 2(77.6)+2(78.3) 2 2(82)+2(74) 2 It cannot be determined from the information given.D Question 15 1 pts The results from a 29 question pre-test given in 2000 and 2010 are represented in the boxplots below. Based on these boxplots, which of the following is a correct conclusion? 2000 2010 5 11 13 15 17 19 21 23 25 27 29 source: http://web.mnstate.edu/peil/MDEV102/U4/$36/Motivate1.PNG The medians are the same for both samples. The interquartile ranges are the same for both samples. The range for 2010 scores is greater than the range for 2000 scores. There are more scores greater than 17 for 2010 scores than there are for 2000 scores. O The highest and lowest scores were both achieved in 2010.much time on any one problem. D Question 1 1 pts A science teacher was conducting an experiment in class in which the students recorded the amount of time a paper plane was in the air. The experiment was repeated and students measured the length of the plane, in centimeters, and the time, in seconds. A linear relationship was observed and the correlation coefficient was 0.964. After discussing their results, the teacher instructed the students to convert all of the length measurements to meters but leave the time in seconds. What effect will this have on the correlation of the two variables? Because the standard deviation of the lengths in meters will be one hundredth of the standard deviation of the lengths in centimeters, the correlation will decrease by one hundredth to 0.954. Because the standard deviation of the lengths in meters will be one hundredth of the standard deviation of the lengths in centimeters, the correlation will decrease proportionally to 0.00964. Because changing from centimeters to meters does not affect the value of the correlation, the correlation will remain 0.964. O Because only the length measurements have been changed, the correlation will decrease substantially. Because meters are a much more common measurement for length in determining speed, the linear relationship of the data will be stronger and thus the correlation will increase substantially