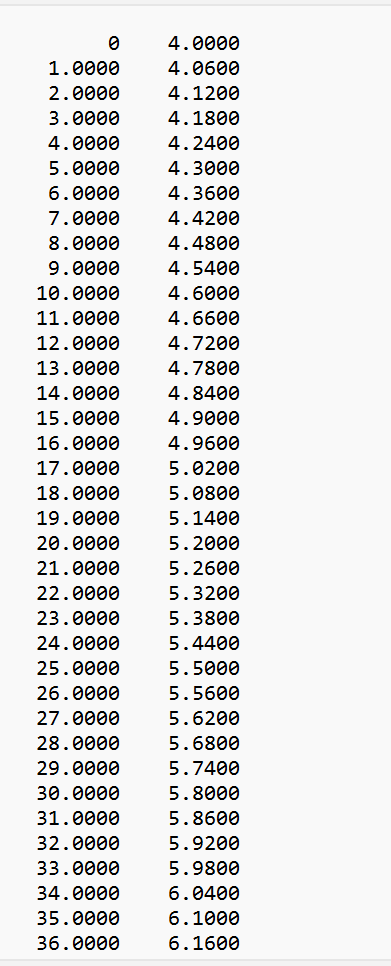
This is what the linear velocity data looks like. I do not need you actually put this code in. i just have 2 column velocity data. I mentioned the name of the data to use in the code so that it will work with my downloaded data.
 Could you please help me with this assignment? this code directly below is a function that is used in this assignment. Also we are using velocity data. I can include that data if you want. this assignment uses 3 data files. they are velocity profiles, linear, increasing, and low. could you please help me do this assignment? I am willing to post multiple questions for each step if someone is able to answer all of them for me so I can understand what this assignment is asking. This assignment is done in matlab. The data is 2 column data. model1_linear, model2_increase, and model3_low are the file names if you are able to include them in the spots where that data file would be needed. again those 3 files are just text files of 2 column data of velocity profile
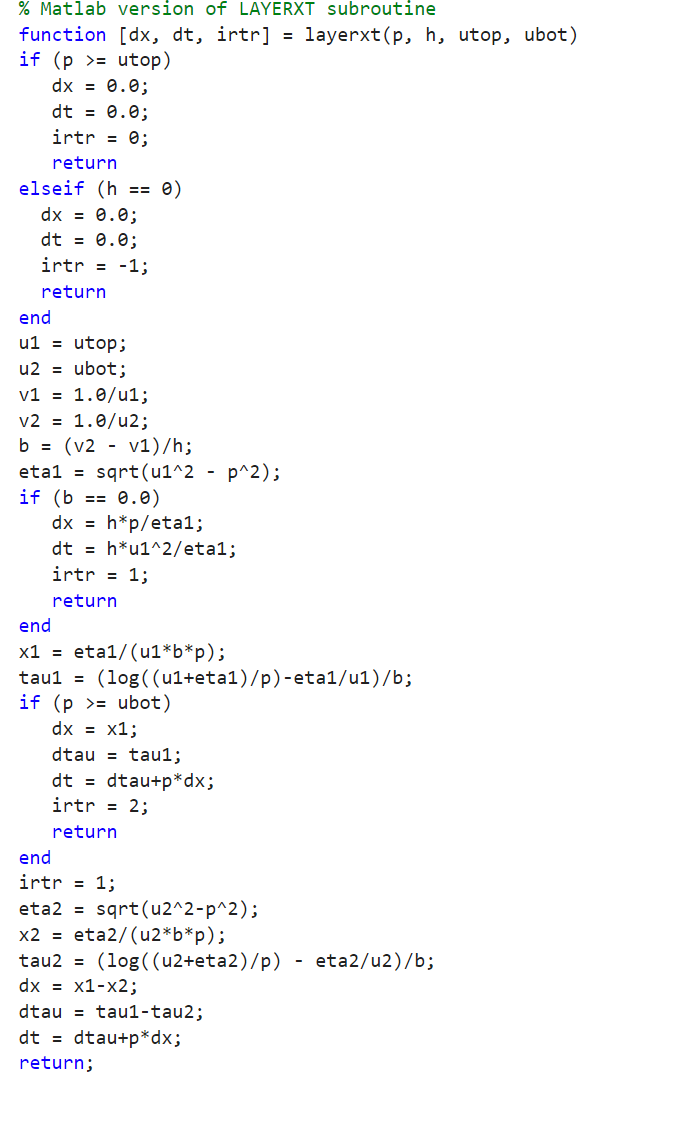
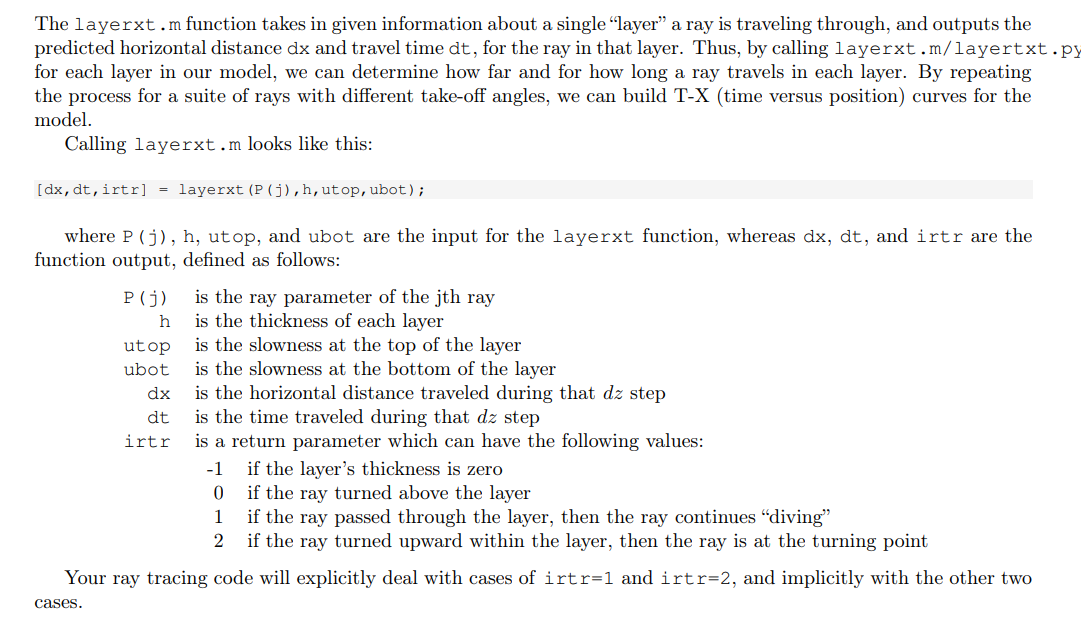
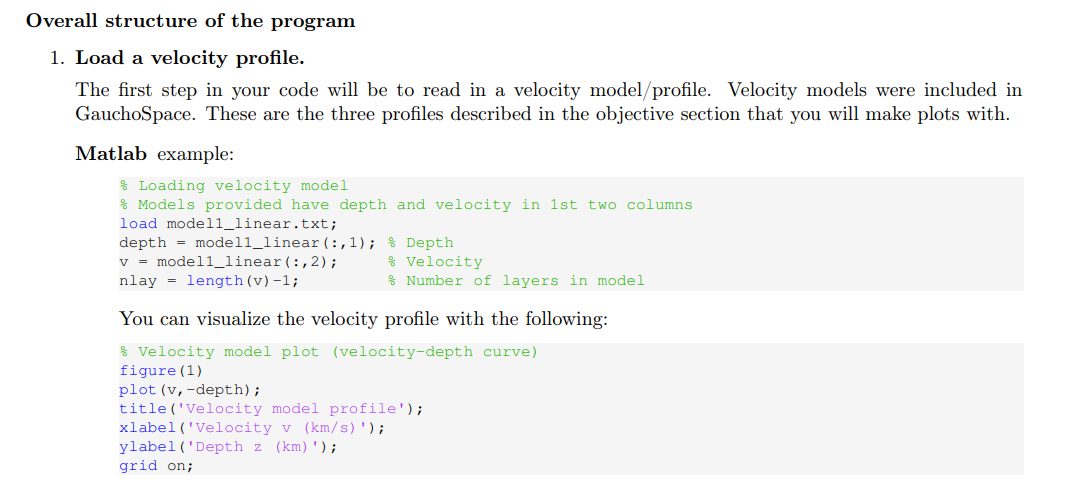
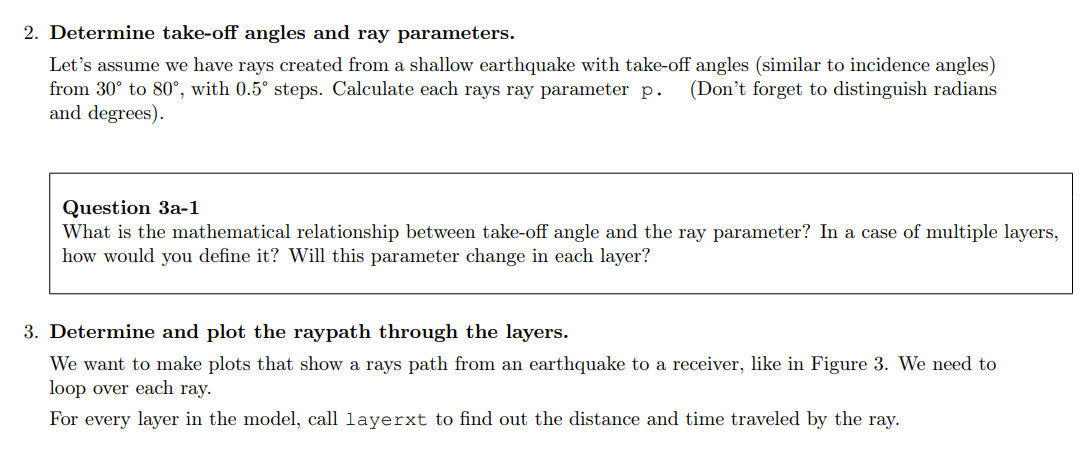

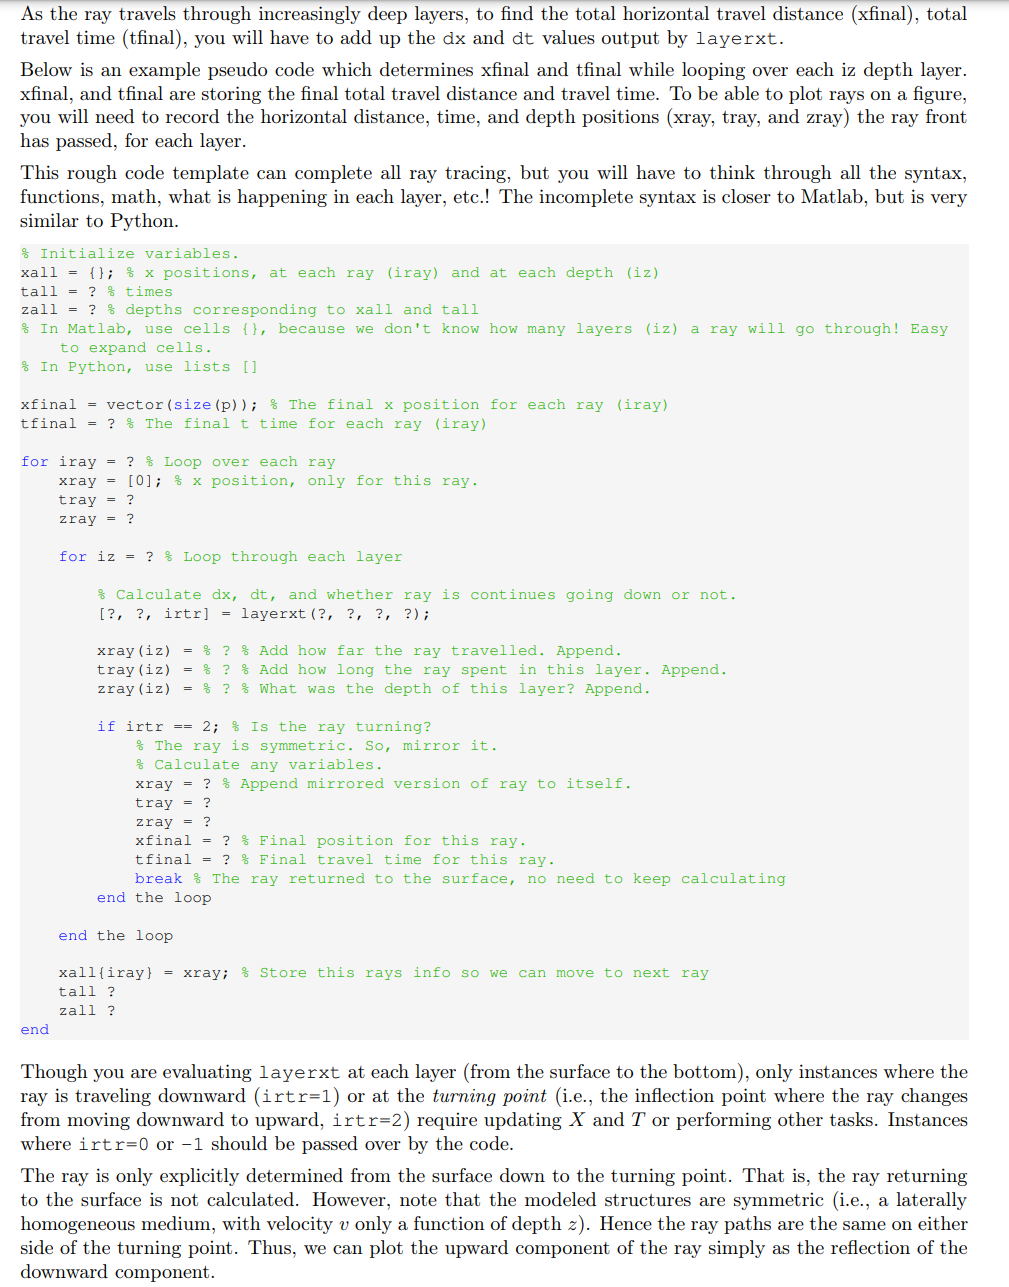
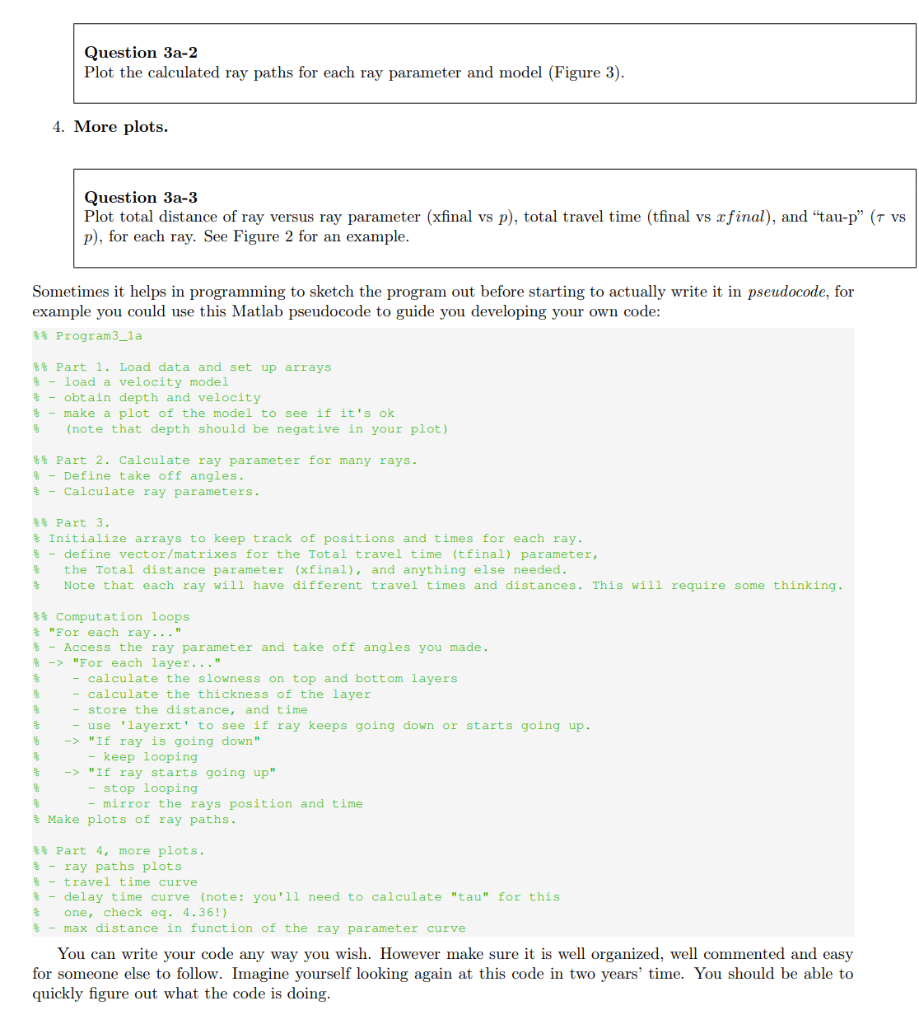
01.00002.00003.00004.00005.00006.00007.00008.00009.000010.000011.000012.000013.000014.000015.000016.000017.000018.000019.000020.000021.000022.000023.000024.000025.000026.000027.000028.000029.000030.000031.000032.000033.000034.000035.000036.00004.00004.06004.12004.18004.24004.30004.36004.42004.48004.54004.60004.66004.72004.78004.84004.90004.96005.02005.08005.14005.20005.26005.32005.38005.44005.50005.56005.62005.68005.74005.80005.86005.92005.98006.04006.10006.1600 The layerxt.m function takes in given information about a single "layer" a ray is traveling through, and outputs the predicted horizontal distance dx and travel time dt, for the ray in that layer. Thus, by calling layerxt . m/ layert xt. for each layer in our model, we can determine how far and for how long a ray travels in each layer. By repeating the process for a suite of rays with different take-off angles, we can build TX (time versus position) curves for the model. Calling layerxt.m looks like this: [dx,dt,irtr]= layerxt (P(j),h,utop,ubot); where P(j),h, utop, and ubot are the input for the layerxt function, whereas dx,dt, and irtr are the function output, defined as follows: P(j) is the ray parameter of the jth ray h is the thickness of each layer utop is the slowness at the top of the layer ubot is the slowness at the bottom of the layer dx is the horizontal distance traveled during that dz step dt is the time traveled during that dz step irtr is a return parameter which can have the following values: 1 if the layer's thickness is zero if the ray turned above the layer if the ray passed through the layer, then the ray continues "diving" if the ray turned upward within the layer, then the ray is at the turning point Your ray tracing code will explicitly deal with cases of irtr=1 and irtr=2, and implicitly with the other two all structure of the program Load a velocity profile. The first step in your code will be to read in a velocity model/profile. Velocity models were included in GauchoSpace. These are the three profiles described in the objective section that you will make plots with. Matlab example: You can visualize the velocity profile with the following: Vocity model plot (velocity-depth curve) figure(1) plot(v,-depth); title('Velocity model profile'); xlabel ('Velocity v (km/s)'); ylabel ('Depth z (km)); grid on; Determine take-off angles and ray parameters. Let's assume we have rays created from a shallow earthquake with take-off angles (similar to incidence angles) from 30 to 80, with 0.5 steps. Calculate each rays ray parameter p. (Don't forget to distinguish radians and degrees). Question 3a-1 What is the mathematical relationship between take-off angle and the ray parameter? In a case of multiple layers how would you define it? Will this parameter change in each layer? Determine and plot the raypath through the layers. We want to make plots that show a rays path from an earthquake to a receiver, like in Figure 3 . We need to loop over each ray. For every layer in the model, call layerxt to find out the distance and time traveled by the ray. Determine take-off angles and ray parameters. Let's assume we have rays created from a shallow earthquake with take-off angles (similar to incidence angles) from 30 to 80, with 0.5 steps. Calculate each rays ray parameter p. (Don't forget to distinguish radians and degrees). Question 3a-1 What is the mathematical relationship between take-off angle and the ray parameter? In a case of multiple layers how would you define it? Will this parameter change in each layer? Determine and plot the raypath through the layers. We want to make plots that show a rays path from an earthquake to a receiver, like in Figure 3 . We need to loop over each ray. For every layer in the model, call layerxt to find out the distance and time traveled by the ray. As the ray travels through increasingly deep layers, to find the total horizontal travel distance (xfinal), total travel time (tfinal), you will have to add up the dx and dt values output by layerxt. Below is an example pseudo code which determines xfinal and tfinal while looping over each iz depth layer. xfinal, and tfinal are storing the final total travel distance and travel time. To be able to plot rays on a figure, you will need to record the horizontal distance, time, and depth positions (xray, tray, and zray) the ray front has passed, for each layer. This rough code template can complete all ray tracing, but you will have to think through all the syntax, functions, math, what is happening in each layer, etc.! The incomplete syntax is closer to Matlab, but is very similar to Python. Question 3a-2 Plot the calculated ray paths for each ray parameter and model (Figure 3). 4. More plots. Question 3a-3 Plot total distance of ray versus ray parameter (xfinal vs p ), total travel time (tfinal vs x final), and "tau-p" ( p ), for each ray. See Figure 2 for an example. Sometimes it helps in programming to sketch the program out before starting to actually write it in pseudocode, for example you could use this Matlab pseudocode to guide you developing your own code: of Program 3 P 1a \% % Part 1. Load data and set up arrays f - load a velocity model * - obtain depth and velocity q - make a plot of the model to see if it's ok (note that depth should be negative in your plot) \& P Part 2. Calculate ray parameter for many rays. 8 - Define take off angles. * - Calculate ray parameters. sof Part 3. * Initialize arrays to keep track of positions and times for each ray. q - define vector/matrixes for the Total travel time (tfinal) parameter, the Total distance parameter (xfinal), and anything else needed. Note that each ray will have different travel times and distances. This will require some thinking . o Computation 100ps "For each ray..." - Access the ray parameter and take off angles you made. 8 o "For each layer..." - calculate the slowness on top and bottom layers - calculate the thickness of the layer - store the distance, and time - use 'layerxt' to see if ray keeps going down or starts going up. "If ray is going down" - keep looping "If ray starts going up" - stop looping - mirror the rays position and time Make plots of ray paths. Part 4 , more plots. * ray paths plots 8 - travel time curve * - delay time curve (note: you'll need to calculate "tau" for this one, check eq. 4.36!) q - max distance in function of the ray parameter curve You can write your code any way you wish. However make sure it is well organized, well commented and easy for someone else to follow. Imagine yourself looking again at this code in two years' time. You should be able to quickly figure out what the code is doing