

Answered step by step
Verified Expert Solution
Question
1 Approved Answer
Based on the dataset information given above, please answer the following questions. You are required to perform the following tasks using R Studio. Please provide
Based on the dataset information given above, please answer the following questions. You are required to perform the following tasks using R Studio. Please provide the script, and screenshot of the output.
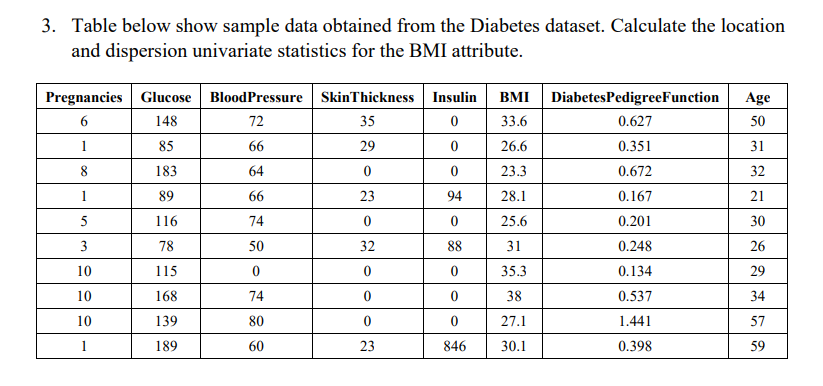
Q If you want to see the st Quartile, Median and rd Quartile of DiabetesPedigreeFunction, which plot is suitable to visualize these three information? Visualize the plot with appropriate header and label.Table below show sample data obtained from the Diabetes dataset. Calculate the location
and dispersion univariate statistics for the BMI attribute.
Step by Step Solution
There are 3 Steps involved in it
Step: 1

Get Instant Access to Expert-Tailored Solutions
See step-by-step solutions with expert insights and AI powered tools for academic success
Step: 2

Step: 3
Ace Your Homework with AI
Get the answers you need in no time with our AI-driven, step-by-step assistance
Get Started
Logistics Lifeline Supply Chain Strategies
Authors: Ehsan Sheroy
1st Edition
7419377502, 978-7419377503