

Question
This mini-task consists of two parts: in Part A you will interpret SPSS output for Cross-Tabulation and in Part B you will perform analysis in
This mini-task consists of two parts: in Part A you will interpret SPSS output for Cross-Tabulation and in Part B you will perform analysis in SPSS yourself.
Part A
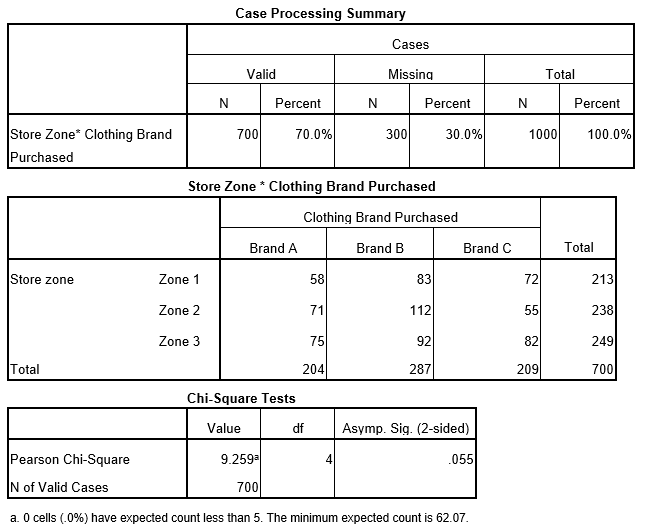
The following statistical output (SPSS) was produced by a market researcher:
Step by Step Solution
There are 3 Steps involved in it
Step: 1

Get Instant Access to Expert-Tailored Solutions
See step-by-step solutions with expert insights and AI powered tools for academic success
Step: 2

Step: 3
Ace Your Homework with AI
Get the answers you need in no time with our AI-driven, step-by-step assistance
Get Started
Foundations of Marketing
Authors: William M. Pride, O. C. Ferrell
3rd Edition
618973370, 547154569, 9780618973378, 978-0547154565