

Question
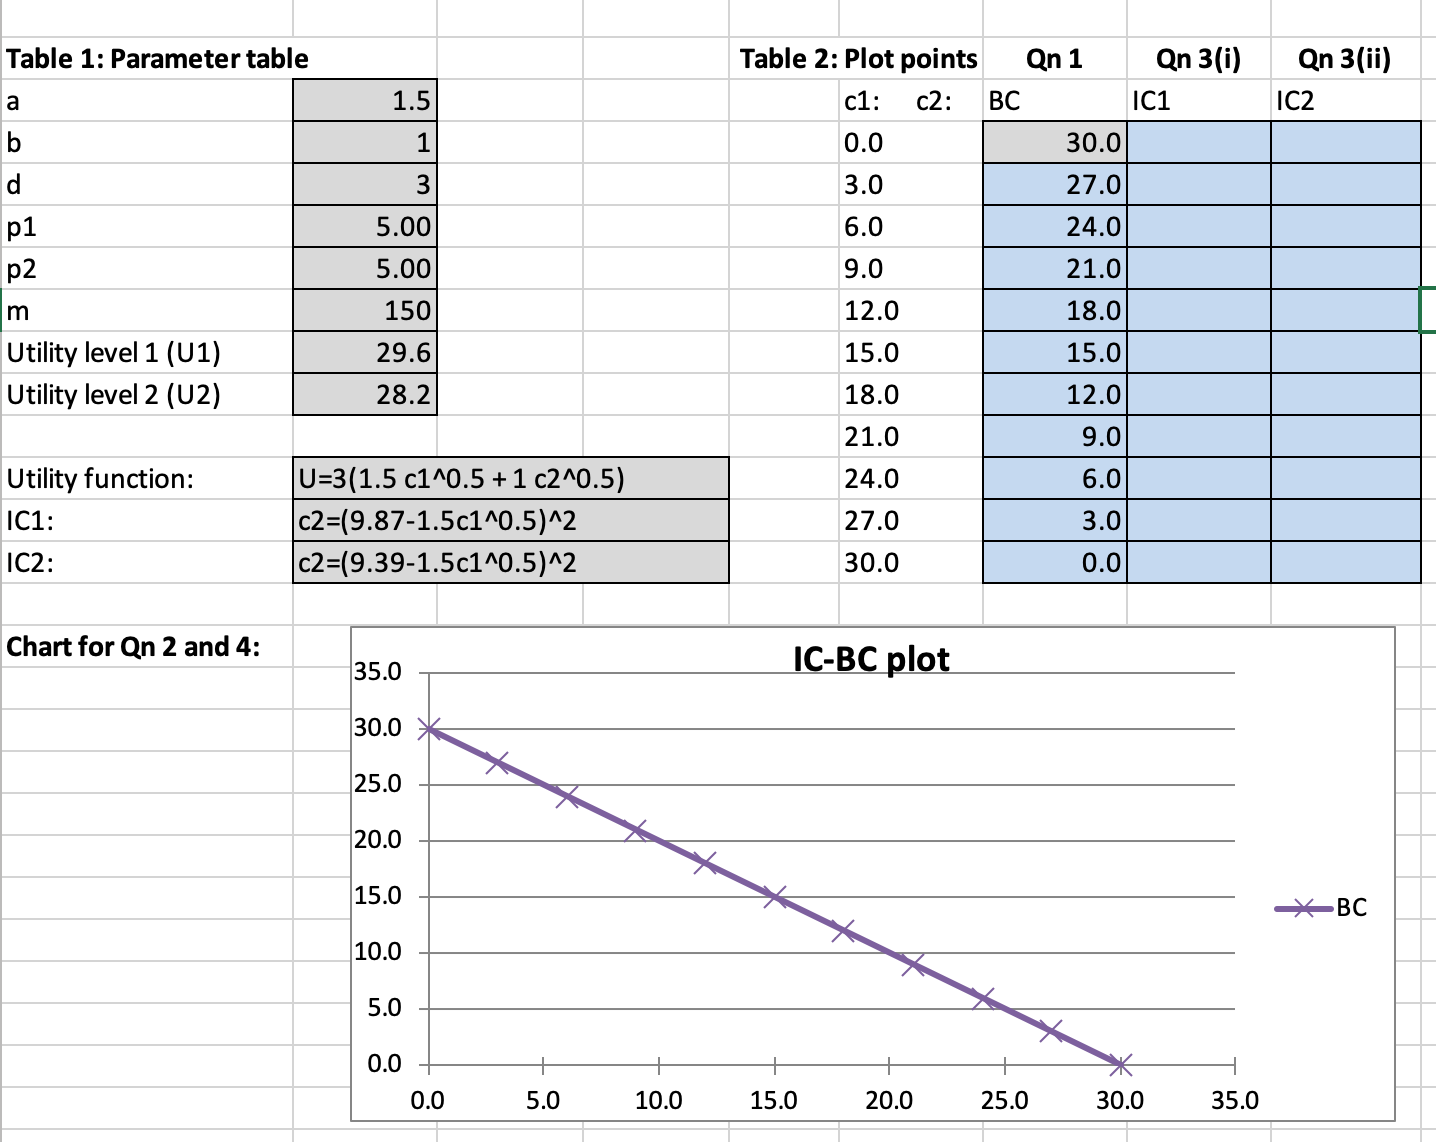
This question refers to the utility function and indifference curve equations below the Parameter table. Use the equation for the indifference curve for a given
This question refers to the utility function and indifference curve equations below the Parameter table. Use the equation for the indifference curve for a given level of utility to calculate a set of plot points. Each set of plot points is for one indifference curve (IC1 and IC2). Based on the given levels of utility indicated, calculate a set of points (in the Table of plot points, for the range given) for:
(i) U1 (using the equation for IC1) and,
(ii) U2 (using the equation for IC2).
Step by Step Solution
There are 3 Steps involved in it
Step: 1

Get Instant Access to Expert-Tailored Solutions
See step-by-step solutions with expert insights and AI powered tools for academic success
Step: 2

Step: 3
Ace Your Homework with AI
Get the answers you need in no time with our AI-driven, step-by-step assistance
Get Started
Intermediate Microeconomics and Its Application
Authors: walter nicholson, christopher snyder
11th edition
9781111784300, 324599102, 1111784302, 978-0324599107