This study involved the development of an electrochemical sensor to detect E.coli bacteria in patients with chronic wounds. The electrochemical sensor uses a technique called
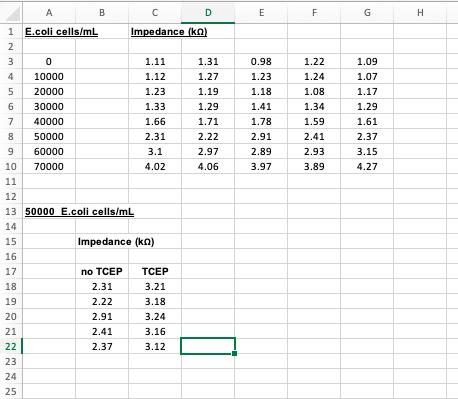
This study involved the development of an electrochemical sensor to detect E.coli bacteria in patients with chronic wounds. The electrochemical sensor uses a technique called “impedance” to measure E.coli DNA in the sample. In this study, samples of wound fluid containing different concentrations of E.coli (cells/mL) were taken from patients. The performance of the impedance sensor was evaluated by measuring the impedance (kΩ) over a range of concentrations (0 to 70,000 E.coli cells/mL).
When developing a sensor it is important to correctly establish the limit of detection (LOD). The LOD can be defined as a baseline, instrumental or zero value + 3 standard deviations. The measured value from a particular sample concentration must be greater than the LOD in order to achieve successful detection.
Finally, a compound called TCEP (tris(2carboxyethyl)phosphine) was used to prepare the sensor surface. The idea behind this experiment was to determine if TCEP use could improve the performance of the E.coli test. The performance of the sensor was measured using electrodes prepared normally and electrodes pre-treated with TCEP and samples containing 50,000 cells/mL.
Key research questions to be addressed:
1) What is the relationship between impedance (kΩ) and E.coli concentration?
2) What is the limit of detection?
3) How do the responses of non-treated and TCEP treated electrodes compare to each other?
Are they significantly different? Comment on the effect of TCEP on assay performance.


A 1 E.coli cells/mL 123 0 4 10000 5 20000 6 30000 7 40000 8 50000 9 60000 70000 10 11 B D Impedance (kn) 12 13 50000 E.coli cells/mL 14 15 16 17 18 19 20 21 22 23 24 25 no TCEP 2.31 2.22 2.91 2.41 2.37 1.11 1.12 1.23 1.33 1.66 2.31 3.1 4.02 Impedance (kn) TCEP 3.21 3.18 3.24 3.16 3.12 1.31 1.27 1.19 1.29 1.71 2.22 2.97 4.06 E 0.98 1.23 1.18 1.41 1.78 2.91 2.89 3.97 F 1.22 1.24 1.08 1.34 1.59 2.41 2.93 3.89 G 1.09 1.07 1.17 1.29 1.61 2.37 3.15 4.27 H
Step by Step Solution
3.56 Rating (160 Votes )
There are 3 Steps involved in it
Step: 1
1 What is the relationship between impedance k and Ecoli concentration The relationship between impe...
See step-by-step solutions with expert insights and AI powered tools for academic success
Step: 2

Step: 3

Ace Your Homework with AI
Get the answers you need in no time with our AI-driven, step-by-step assistance
Get Started


