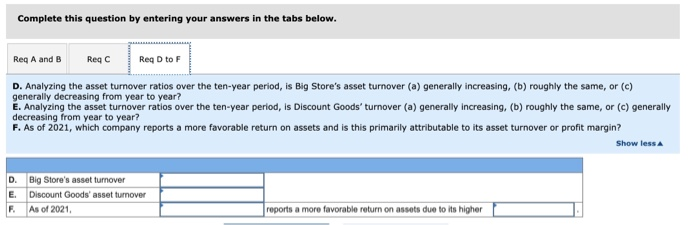
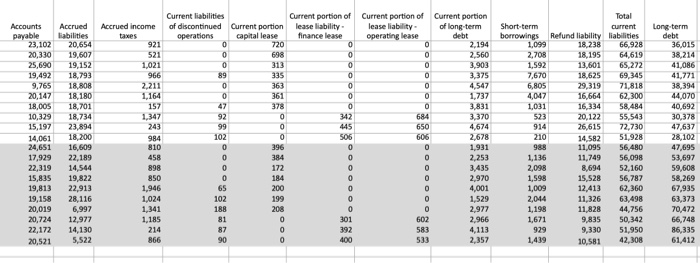
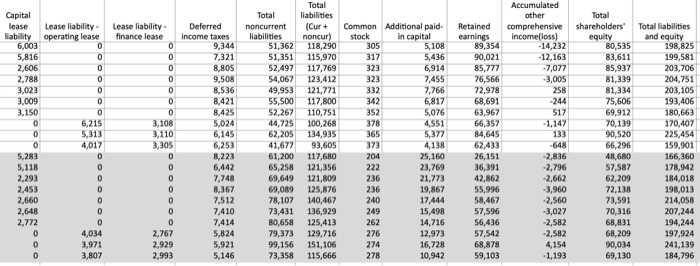
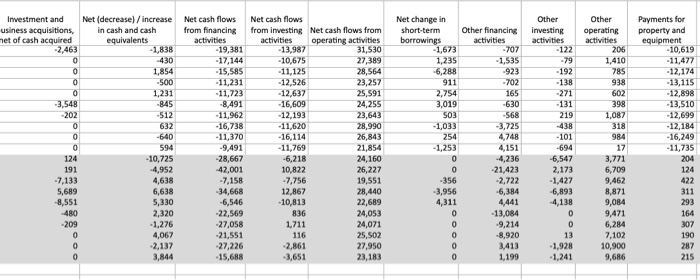
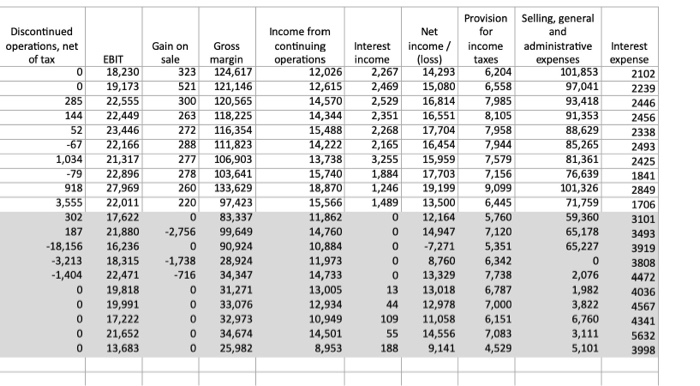
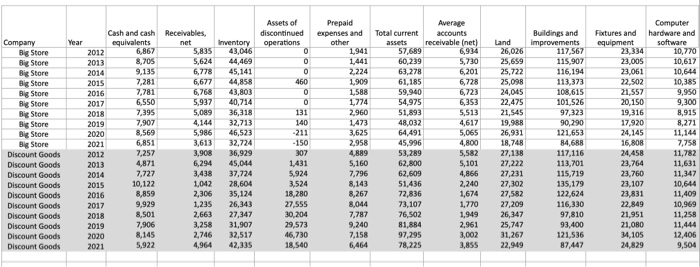
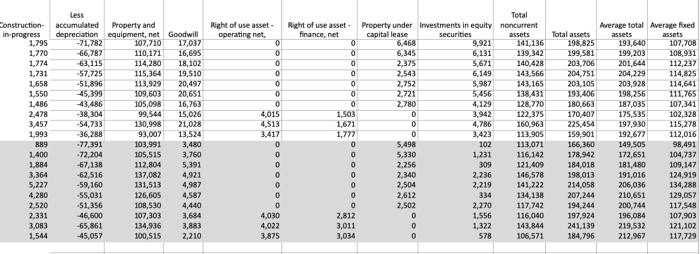
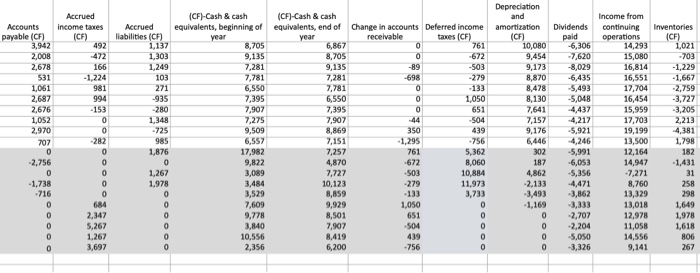
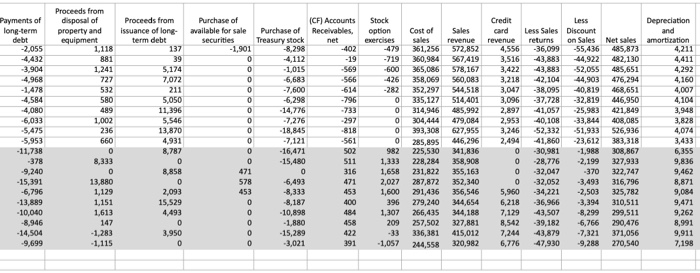
thoses are the number you can use on tableau to get the numbers
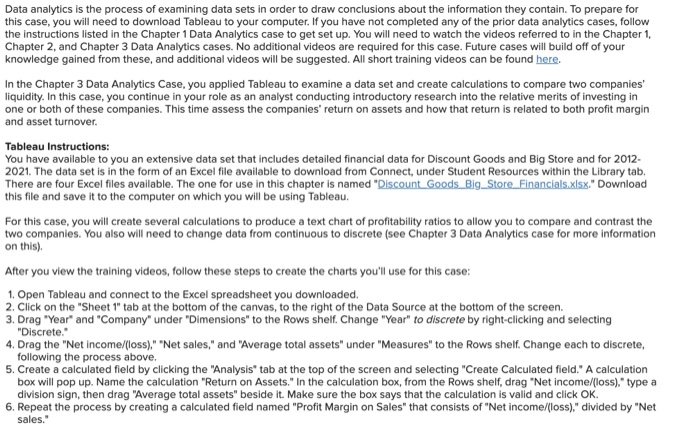
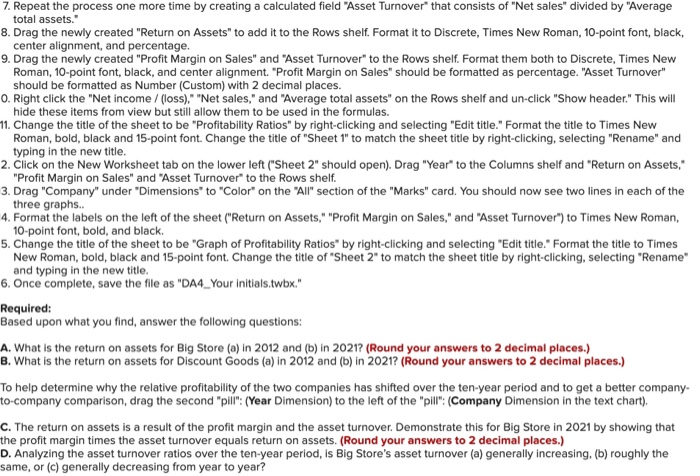
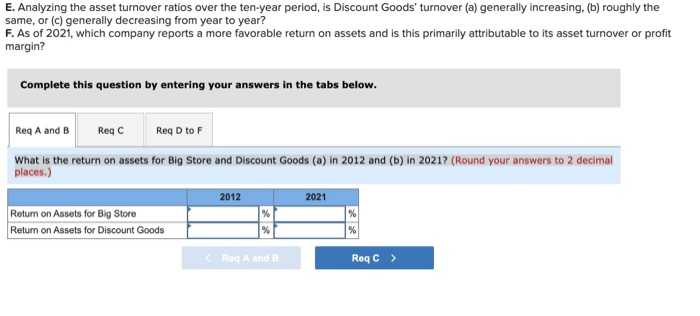
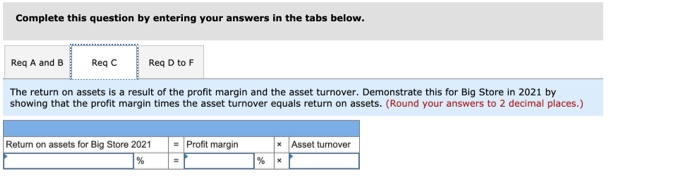
Data analytics is the process of examining data sets in order to draw conclusions about the information they contain. To prepare for this case, you will need to download Tableau to your computer. If you have not completed any of the prior data analytics cases, follow the instructions listed in the Chapter 1 Data Analytics case to get set up. You will need to watch the videos referred to in the Chapter 1, Chapter 2, and Chapter 3 Data Analytics cases. No additional videos are required for this case. Future cases will build off of your knowledge gained from these, and additional videos will be suggested. All short training videos can be found here. In the Chapter 3 Data Analytics Case, you applied Tableau to examine a data set and create calculations to compare two companies liquidity. In this case, you continue in your role as an analyst conducting introductory research into the relative merits of investing in one or both of these companies. This time assess the companies' return on assets and how that return is related to both profit margin and asset turnover Tableau Instructions: You have available to you an extensive data set that includes detailed financial data for Discount Goods and Big Store and for 2012- 2021. The data set is in the form of an Excel file available to download from Connect, under Student Resources within the Library tab. There are four Excel files available. The one for use in this chapter is named "Discount Goods Big_Store Financials.xlsx." Download this file and save it to the computer on which you will be using Tableau. For this case, you will create several calculations to produce a text chart of profitability ratios to allow you to compare and contrast the two companies. You also will need to change data from continuous to discrete (see Chapter 3 Data Analytics case for more information on this) After you view the training videos, follow these steps to create the charts you'll use for this case: 1. Open Tableau and connect to the Excel spreadsheet you downloaded. 2. Click on the "Sheet 1" tab at the bottom of the canvas, to the right of the Data Source at the bottom of the screen. 3. Drag "Year" and "Company" under "Dimensions" to the Rows shelf. Change "Year" to discrete by right-clicking and selecting "Discrete." 4. Drag the "Net income/(loss)." "Net sales," and "Average total assets" under "Measures" to the Rows shelf. Change each to discrete, following the process above. 5. Create a calculated field by clicking the "Analysis" tab at the top of the screen and selecting "Create Calculated field." A calculation box will pop up. Name the calculation "Return on Assets." In the calculation box, from the Rows shelf, drag "Net income/(loss)," type a division sign, then drag "Average total assets" beside it. Make sure the box says that the calculation is valid and click OK. 6. Repeat the process by creating a calculated field named "Profit Margin on Sales" that consists of "Net income/loss)," divided by "Net sales." 7. Repeat the process one more time by creating a calculated field "Asset Turnover" that consists of "Net sales" divided by "Average total assets." 8. Drag the newly created "Return on Assets" to add it to the Rows shelf. Format it to Discrete, Times New Roman, 10-point font, black, center alignment, and percentage. 9. Drag the newly created "Profit Margin on Sales" and "Asset Turnover" to the Rows shelf. Format them both to Discrete, Times New Roman, 10-point font, black, and center alignment. "Profit Margin on Sales" should be formatted as percentage. "Asset Turnover" should be formatted as Number (Custom) with 2 decimal places. O. Right click the "Net income / (loss)." "Net sales," and "Average total assets" on the Rows shelf and un-click "Show header." This will hide these items from view but still allow them to be used in the formulas. 11. Change the title of the sheet to be "Profitability Ratios" by right-clicking and selecting "Edit title." Format the title to Times New Roman, bold, black and 15-point font. Change the title of "Sheet 1" to match the sheet title by right-clicking, selecting "Rename" and typing in the new title. 2. Click on the New Worksheet tab on the lower left ("Sheet 2" should open). Drag "Year" to the Columns shelf and "Return on Assets," "Profit Margin on Sales" and "Asset Turnover to the Rows shelf. 3. Drag "Company" under "Dimensions" to "Color" on the "All section of the "Marks" card. You should now see two lines in each of the three graphs. 4. Format the labels on the left of the sheet ("Return on Assets," "Profit Margin on Sales," and "Asset Turnover") to Times New Roman, 10-point font, bold, and black. 5. Change the title of the sheet to be "Graph of Profitability Ratios" by right-clicking and selecting "Edit title." Format the title to Times New Roman, bold, black and 15-point font Change the title of "Sheet 2" to match the sheet title by right-clicking, selecting "Rename" and typing in the new title. 6. Once complete, save the file as "DA4_Your initials.twbx." Required: Based upon what you find answer the following questions: A. What is the return on assets for Big Store (a) in 2012 and (b) in 2021? (Round your answers to 2 decimal places.) B. What is the return on assets for Discount Goods (a) in 2012 and (b) in 2021? (Round your answers to 2 decimal places.) To help determine why the relative profitability of the two companies has shifted over the ten-year period and to get a better company- to-company comparison, drag the second "pill": (Year Dimension) to the left of the "pill": (Company Dimension in the text chart). C. The return on assets is a result of the profit margin and the asset turnover. Demonstrate this for Big Store in 2021 by showing that the profit margin times the asset turnover equals return on assets. (Round your answers to 2 decimal places.) D. Analyzing the asset turnover ratios over the ten-year period, is Big Store's asset turnover (a) generally increasing, (b) roughly the same, or (c) generally decreasing from year to year? E. Analyzing the asset turnover ratios over the ten-year period, is Discount Goods' turnover (a) generally increasing, (b) roughly the same, or (c) generally decreasing from year to year? F. As of 2021, which company reports a more favorable return on assets and is this primarily attributable to its asset turnover or profit margin? Complete this question by entering your answers in the tabs below. Reg A and B Reg C Reg D to F What is the return on assets for Big Store and Discount Goods (a) in 2012 and (b) in 2021? (Round your answers to 2 decimal places.) 2012 2021 Return on Assets for Big Store Return on Assets for Discount Goods % % % Reg A and B Reqc > Complete this question by entering your answers in the tabs below. Req A and B ReqC Reg D to F The return on assets is a result of the profit margin and the asset turnover. Demonstrate this for Big Store in 2021 by showing that the profit margin times the asset turnover equals return on assets. (Round your answers to 2 decimal places.) Profit margin * Asset turnover Return on assets for Big Store 2021 % % Complete this question by entering your answers in the tabs below. Reg A and B Reqc Reg D to F D. Analyzing the asset turnover ratios over the ten-year period, is Big Store's asset turnover (a) generally increasing, (b) roughly the same, or (c) generally decreasing from year to year? E. Analyzing the asset turnover ratios over the ten-year period, is Discount Goods' turnover (a) generally increasing, (b) roughly the same, or (c) generally decreasing from year to year? F. As of 2021, which company reports a more favorable return on assets and is this primarily attributable to its asset turnover or profit margin? Show less D. Big Store's asset turnover E. Discount Goods' asset turnover As of 2021 reports a more favorable return on assets due to its higher Average accounts receivable (net) 6,934 5,730 6,201 6,728 8,915 8.569 Company Big Store Big Store Big Store Big Store Big Store Big Store Big Store Big Store Big Store Big Store Discount Goods Discount Goods Discount Goods Discount Goods Discount Goods Discount Goods Discount Goods Discount Goods Discount Goods Discount Goods Cash and cash Receivables, Year equivalents net 2012 6,867 5,835 2013 8,705 5,624 2014 9,135 6,778 2015 7,281 6,677 2016 7,781 6,768 2017 6.550 5,937 2018 7,395 5,089 2019 7,907 4,144 2020 5.986 2021 6,851 3,613 2012 7,257 3,908 2013 4,871 6,294 2014 7.727 3,438 2015 10,122 1,042 8,859 2,306 2017 9,929 1,235 2018 8,501 2,663 2019 7,906 3,258 2020 8,145 2,746 2021 5,922 4,964 Inventory 43,046 44,469 45,141 44,858 43,803 40,714 36,318 32,713 46,523 32,724 36,929 45,014 37,724 28,604 35,124 26,343 27,347 31,907 32,517 42,335 Assets of discontinued operations 0 0 0 460 0 0 131 140 -211 - 150 307 1,431 5,924 3,524 18,280 27.555 30,204 29,573 46,730 18,540 Prepaid expenses and other 1,941 1,441 2,224 1,909 1.588 1,774 2,960 1,473 3,625 2,958 4,889 5,160 7.796 8,143 8,267 8,044 7,787 9,240 7,158 6,464 Total current assets 57,689 60,239 63,278 61,185 59,940 54,975 51,893 48,032 64,491 45,996 53,289 62,800 62,609 51,436 72,836 73,107 76,502 81,884 97,295 78,225 6,353 5,513 4,617 5,065 4,800 5,582 5,101 4,866 2,240 1,674 1.770 1,949 2,961 3,002 3,855 Land 26,026 25,659 25,722 25,098 24,045 22,475 21,545 19,988 26,931 18,748 27,138 27,222 27,231 27,302 27,582 27,209 26,347 25,747 31,267 22,949 Buildings and improvements 117,567 115,907 116,194 113,373 108,615 101 526 97,323 90,290 121,653 84,688 117,116 113,701 115,719 135,179 122,624 116,330 97,810 93,400 121,536 87,447 Computer Fixtures and hardware and equipment software 23,334 10,770 23,005 10,617 23,061 10,644 22,502 10,385 21,557 9,950 20,150 9,300 19,316 17,920 8,271 24,145 16,808 7,758 24,458 11,782 23,764 11,631 23,760 11,347 23,107 10,644 23,831 11,409 22,849 10,969 21.951 11,258 21.080 11,444 34,105 12,406 24,829 9,504 2016 Right of use asset operating net 0 0 O 0 0 Construction- in progress 1.795 1,770 1,774 1,731 1,658 1,550 1.486 2,478 3,457 1.993 889 1,400 1,884 3,364 5,227 4,280 2.520 2,331 3,083 1.544 Less accumulated Property and depreciation equipment, net Goodwill -71,782 107,710 17,037 -66,787 110,171 16,695 -63,115 114,280 18,102 -57,725 115,364 19,510 -51,896 113,929 20,497 -45,399 109,603 20,651 -43,486 105,098 16,763 -38,304 99,544 15,026 -54,733 130,998 21,028 -36,288 93,007 13,524 -77,391 103,991 -72,204 105,515 3,760 -67,138 112,804 5,391 -62,516 137,082 4,921 -59,160 131,513 4,987 -55,031 126,605 4,587 -51,356 108,530 4,440 -46,600 107,303 3,684 -65,861 134,936 3,883 -45,057 100,515 2,210 0 0 4,015 4,513 3,412 0 Right of use asset finance, net 0 0 0 0 0 0 0 1,503 1,671 1,777 0 0 0 0 0 0 0 2,812 3,011 3,034 Total Property under investments in equity noncurrent capital lease securities assets 6,468 9,921 141, 136 6,345 6,131 139,342 2,375 5,671 140,428 2,543 6,149 143,566 2,752 5,987 143,165 2,721 5,456 138,431 2,780 4,129 128,770 0 3,942 122,375 0 4,786 160,963 0 3,423 113,905 5,498 102 113,071 5,330 1,231 116,142 2,256 309 121.409 2,340 2,236 146,578 2,504 2,219 141,222 2,612 334 134,138 2,502 2,270 117,742 0 1,556 116,040 0 1,322 143,844 0 578 106,571 Average total Average fored Total assets assets assets 198 825 193,640 107,708 199,581 199,203 108,931 203,706 201,644 112,237 204,751 204,229 114,825 203, 105 203,928 114,641 193,406 198,256 111,765 180,663 187,035 107,341 170,407 175,535 102,328 225,454 197,930 115,278 159,901 192,677 112,016 166,360 149,505 98,491 178,942 172,651 104,737 184,018 181,480 109,147 198,013 191,016 124,919 214,058 206,036 134,288 207,244 210,651 129,057 194,244 200,744 117,548 197,924 196,084 107,903 241,139 219,532 121,102 184,796 212,967 117,729 3,480 OOOOO 0 4,030 4,022 3,875 Accrued income 921 Current portion of long-term debt 2,194 2,560 3,903 3,375 4,547 1,737 Accounts payable 23,102 20,330 25,690 19,492 9,765 20,147 18,005 10,329 15,197 14,061 24,651 17,929 22,319 15,835 19,813 19,158 20,019 20,724 22,172 20,521 Accrued liabilities 20,654 19,607 19,152 18,793 18,808 18,180 18,701 18,734 23,894 18,200 16,609 22,189 14,544 19,822 22,913 28, 116 6,997 12,977 14,130 5,522 521 1,021 966 2,211 1,164 157 1,347 243 984 810 458 898 850 1,946 1,024 1,341 1,185 214 866 Current liabilities of discontinued Current portion operations capital lease 720 0 698 0 313 89 335 0 363 0 361 47 378 92 0 99 0 102 0 0 396 0 384 0 172 0 184 65 200 102 199 188 208 81 0 87 0 90 0 Current portion of Current portion of lease liability lease liability finance lease operating lease 0 0 0 0 0 0 0 0 0 0 0 0 0 342 684 445 650 506 606 0 0 0 0 0 0 0 0 0 0 0 0 0 0 301 602 392 583 400 533 3,831 3.370 4,674 2.678 1,931 2,253 3,435 2.970 4,001 1,529 2,977 2,966 4,113 2,357 Short-term borrowings 1,099 2,708 1,592 7,670 6,805 4,047 1,031 523 914 210 988 1,136 2,098 1,598 1,009 2,014 1,198 1,671 929 1,439 Total current Refund liability liabilities 18.238 66,928 18,195 64,619 13,601 65,272 18,625 69,345 29,319 71,818 16,664 62,300 16,334 58,484 20,122 55,543 26,615 72,730 14,582 51.928 11,095 56,480 11,749 56,098 8,694 52,160 15,528 56,787 12,413 62,360 11,326 63,498 11,828 44,756 9,835 50,342 9,330 51,950 10,581 42,308 Long-term debt 36,015 38,214 41,086 41,771 38,394 44,070 40,692 30,378 47,637 28,102 47,695 53,697 59,608 58,269 67,935 63,373 70,472 66,748 86,335 61,412 5.108 317 Capital lease liability 6,003 5,816 2,606 2,788 3,023 3,009 3,150 0 0 0 5,283 5,118 2,293 2.453 2,660 2,648 2,772 0 Lease liability - Lease liability operating lease finance lease 0 0 0 0 0 0 0 0 0 0 0 0 0 0 6,215 3,108 5,313 3,110 4,017 3,305 0 0 0 0 0 0 0 0 0 0 0 0 0 0 2,767 3,971 2,929 3,807 2,993 Deferred income taxes 9,344 7,321 8,805 9,508 8,536 8,421 8,425 5,024 6,145 6,253 8,223 6,442 7,748 8,367 Total noncurrent liabilities 51,362 51,351 52,497 54,067 49,953 55,500 52,267 44,725 62,205 41,677 61,200 65,258 69,649 69,089 78,107 73,431 80,658 79,373 99,156 73,358 Total liabilities (Cur+ noncur) 118,290 115,970 117,769 123,412 121,771 117,800 110,751 100,268 134,935 93,605 117,680 121,356 121,809 125,876 140,467 136,929 125,413 129,716 151, 106 115,666 Common Additional paid- stock in capital 305 5,436 323 6,914 323 7,455 332 7,766 342 6,817 352 5,076 378 4,551 365 5,377 373 4,138 204 25,160 222 23,769 236 21,773 236 19,867 17,444 249 15,498 262 14,716 276 12,973 274 16,728 278 10,942 Retained earnings 89,354 90,021 85,777 76,566 72,978 68,691 63,967 66,357 84,645 62,433 26,151 36,391 42,862 55,996 58,467 57,596 56,436 57,542 68,878 59,103 Accumulated other comprehensive income(loss) -14,232 12,163 -7,077 -3,005 258 -244 517 - 1,147 133 -648 -2,836 -2,796 -2,662 -3,960 -2.560 -3,027 -2,582 -2,582 4,154 - 1,193 Total shareholders equity 80,535 83,611 85,937 81,339 81,334 75,606 69,912 70,139 90,520 66,296 48,680 57,587 62,209 72,138 73,591 70,316 68,831 68,209 90,034 69,130 Total liabilities and equity 198,825 199,581 203,706 204,751 203,105 193,406 180,663 170,407 225,454 159,901 166,360 178,942 184,018 198,013 214,058 207,244 194,244 197,924 241,139 184,796 240 7,512 7,410 7.414 4,034 5,824 0 0 5,921 5,146 Accrued income taxes (CF) Dividends pald -6,306 492 Accounts payable (CF) 3,942 2,008 2,678 531 1,061 2,687 2,676 1,052 2.970 707 166 -1,224 981 994 -153 0 0 -282 0 0 0 0 0 684 2,347 5,267 1.267 3,697 Accrued liabilities (CF) 1,137 1,303 1,249 103 271 -935 -280 1,348 -725 985 1,876 0 1,267 1.978 0 0 0 0 (CF)-Cash & cash (CF)-Cash & cash equivalents, beginning of equivalents, end of Change in accounts Deferred income year year receivable taxes (CF) 8,705 6,867 0 761 9,135 8,705 0 -672 7,281 9,135 -89 -503 7,781 7,281 -698 -279 6,550 7,781 0 - 133 7,395 6,550 0 1,050 7,907 7,395 651 7,275 7,907 44 9,509 8,869 350 439 6,557 7,151 -1,295 17,982 7,257 761 5,362 9,822 4,870 -672 8,060 3,089 7,727 -503 10,884 3,484 10,123 -279 11,973 3,529 8,859 3,733 7,609 9,929 1,050 0 9,778 8,501 651 0 3,840 7,907 -504 0 10,556 8.419 439 2,356 6,200 -756 Depreciation and amortization (CF) 10,080 9,454 9,173 8,870 8,478 8,130 7,641 7,157 9,176 6,446 302 187 4,862 -2,133 -3,493 -1,169 0 0 0 0 -8,029 -6,435 -5,493 -5,048 4,437 -4,217 -5,921 -4,246 -5,991 -6,053 -5,356 -4,471 -3,862 -3,333 -2,707 -2,204 -5,050 -3,326 Income from continuing operations 14,293 15,080 16,814 16,551 17,704 16,454 15,959 17,703 19,199 13,500 12,164 14,947 -7,271 8,760 13,329 13,018 12,978 11,058 14,556 9,141 Inventories (CF) 1,021 -703 -1,229 -1,667 -2,759 -3,727 -3,205 2,213 4,381 1,798 182 -1,431 31 258 298 1,649 1.978 1,618 806 267 -2,756 0 - 1,738 -716 0 0 0 0 0 0 Other investing activities -122 Investment and usiness acquisitions, met of cash acquired 2,463 0 0 0 0 -3,548 -202 0 0 0 124 191 -7,133 5,689 -8,551 -480 -209 0 Net (decrease) / increase Net cash flows in cash and cash from financing equivalents activities -1,838 -19,381 -430 -17,144 1,854 -15,585 -500 -11,231 1,231 -11,723 -845 -8,491 -512 -11,962 632 -16,738 -640 -11,370 594 -9,491 -10,725 -28,667 -4,952 -42,001 4,638 -7,158 6,638 -34,668 5,330 -6,546 2,320 -22,569 -1,276 -27,058 4,067 -21,551 -2,137 -27,226 3,844 -15,688 Net cash flows from investing Net cash flows from activities operating activities -13,987 31,530 -10,675 27,389 -11,125 28,564 -12 526 23,257 -12,637 25,591 -16,609 24,255 12,193 23,643 11,620 28,990 -16,114 26,843 -11,769 21,854 -6,218 24,160 10,822 26,227 -7,756 19,551 12,867 28,440 -10,813 22,689 836 24,053 24,071 116 25,502 -2,861 27,950 -3,651 23,183 Net change in short-term borrowings -1,673 1,235 -6,288 911 2,754 3,019 503 -1,033 254 -1,253 0 0 -356 -3,956 4,311 0 0 Other financing activities -707 -1,535 -923 -702 165 -630 -568 -3,725 4.748 4,151 -4,236 -21,423 -2,722 -6,384 4,441 - 13,084 -9,214 -8.920 3,413 1,199 -192 - 138 -271 131 219 -438 -101 -694 -6,547 2,173 -1.427 -6,893 -4,138 0 0 13 -1,928 - 1,241 Other operating activities 206 1,410 785 938 602 398 1,087 318 984 17 3,771 6,709 9,462 8,871 9,084 9,471 6,284 7.102 10,900 9,686 Payments for property and equipment -10,619 -11,477 -12,174 -13,115 -12,898 -13,510 -12,699 -12,184 -16,249 -11,735 204 124 422 311 293 164 307 190 287 215 1,711 0 0 0 Payments of long-term debt (CF) Accounts Receivables, Less net 2,055 4,432 3.904 -4,968 -1.478 -4,584 -4,080 -6,033 -5,475 -5,953 -11,738 -378 -9,240 -15,391 -6,796 - 13,889 -10,040 -8.946 -14,504 -9,699 Proceeds from disposal of property and equipment 1.118 881 1,241 727 532 580 489 1,002 236 660 0 8,333 0 13,880 1,129 1.151 1,613 147 -1,283 -1,115 Proceeds from issuance of long- term debt 137 39 5,174 7,072 211 5,050 11,396 5.546 13,870 4,931 8,787 0 8,858 0 2,093 15,529 Purchase of available for sale Securities -1,901 0 0 0 0 0 0 0 0 0 0 0 471 578 453 0 0 0 0 0 Purchase of Treasury stock -8.298 -4,112 1,015 -6,683 -7,600 -6.298 -14,776 -7,276 -18,845 -7,121 - 16,471 -15,480 0 -6,493 -8,333 -8,187 -10,898 -1,880 -15,289 -3,021 -19 -569 -566 -614 -796 -733 -297 -818 -561 502 511 316 471 453 400 484 458 422 391 Stock option exercises -479 -719 -600 426 -282 0 0 0 0 0 982 1,333 1,658 2,027 1,600 396 1,307 209 Cost of sales 361,256 360,984 365,086 358,069 352,297 335,127 314,946 304,444 393,308 285,895 225,530 228,284 231,822 287,872 291,436 279,240 266,435 257,502 336,381 244,558 Sales revenue 572,852 567,419 578,167 560,083 544,518 514,401 485,992 479,084 627,955 446,296 341,836 358,908 355,163 352,340 356,546 344,654 344,188 327,881 415,012 320,982 Credit card revenue 4,556 3,516 3,422 3,218 3,047 3,096 2,897 2,953 3,246 2,494 0 0 0 0 5,960 6,218 7.129 8,542 7,244 6,776 Less Sales Discount returns on Sales -36,099 -55,436 43,883 44,922 43,883 -52,055 42,104 44,903 -38,095 40,819 -37,728 -32,819 41,057 -25,983 40,108 -33,844 -52,332 -51.933 41,860 -23,612 -30,981 -1.988 -28,776 -2,199 -32,047 -370 -32,052 -3,493 -34,221 -2,503 -36,966 -3,394 43,507 -8,299 -39,182 -6,766 -43,879 -7,321 -47,930 -9,288 Net sales 485,873 482,130 485,651 476,294 468,651 446,950 421,849 408,085 526,936 383,318 308,867 327,933 322,747 316,796 325,782 310,511 299,511 290,476 371,056 270.540 Depreciation and amortization 4,211 4,411 4,292 4,160 4,007 4104 3,948 3,828 4,074 3,433 6,355 9,836 9,462 8,871 9,084 9,471 9,262 8,991 9,911 7,198 0 3,950 0 -1,057 Discontinued operations, net of tax 0 0 285 144 52 -67 1,034 -79 918 3,555 302 187 -18,156 -3,213 -1,404 0 0 0 0 EBIT 18,230 19,173 22,555 22,449 23,446 22,166 21,317 22,896 27,969 22,011 17,622 21,880 16,236 18,315 22,471 19,818 19,991 17,222 21,652 13,683 Gain on sale 323 521 300 263 272 288 277 278 260 220 0 -2,756 0 -1,738 -716 0 0 0 0 0 Gross margin 124,617 121,146 120,565 118,225 116,354 111,823 106,903 103,641 133,629 97,423 83,337 99,649 90,924 28,924 34,347 31,271 33,076 32,973 34,674 25,982 Income from continuing operations 12,026 12,615 14,570 14,344 15,488 14,222 13,738 15,740 18,870 15,566 11,862 14,760 10,884 11,973 14,733 13,005 12,934 10,949 14,501 8,953 Interest income 2,267 2,469 2,529 2,351 2,268 2,165 3,255 1,884 1,246 1,489 0 0 0 0 0 13 44 109 55 188 Net income / (loss) 14,293 15,080 16,814 16,551 17,704 16,454 15,959 17,703 19,199 13,500 12,164 14,947 -7,271 8,760 13,329 13,018 12,978 11,058 14,556 9,141 Provision Selling, general for and income administrative taxes expenses 6,204 101,853 6,558 97,041 7,985 93,418 8,105 91,353 7,958 88,629 7,944 85,265 7,579 81,361 7,156 76,639 9,099 101,326 6,445 71,759 5,760 59,360 7,120 65,178 5,351 65,227 6,342 0 7,738 2,076 6,787 1,982 7,000 3,822 6,151 6,760 7,083 3,111 4,529 5,101 Interest expense 2102 2239 2446 2456 2338 2493 2425 1841 2849 1706 3101 3493 3919 3808 4472 4036 4567 4341 5632 3998 0 Average accounts receivable (net) 6,934 5,730 6,201 6,728 8,915 8.569 Company Big Store Big Store Big Store Big Store Big Store Big Store Big Store Big Store Big Store Big Store Discount Goods Discount Goods Discount Goods Discount Goods Discount Goods Discount Goods Discount Goods Discount Goods Discount Goods Discount Goods Cash and cash Receivables, Year equivalents net 2012 6,867 5,835 2013 8,705 5,624 2014 9,135 6,778 2015 7,281 6,677 2016 7,781 6,768 2017 6.550 5,937 2018 7,395 5,089 2019 7,907 4,144 2020 5.986 2021 6,851 3,613 2012 7,257 3,908 2013 4,871 6,294 2014 7.727 3,438 2015 10,122 1,042 8,859 2,306 2017 9,929 1,235 2018 8,501 2,663 2019 7,906 3,258 2020 8,145 2,746 2021 5,922 4,964 Inventory 43,046 44,469 45,141 44,858 43,803 40,714 36,318 32,713 46,523 32,724 36,929 45,014 37,724 28,604 35,124 26,343 27,347 31,907 32,517 42,335 Assets of discontinued operations 0 0 0 460 0 0 131 140 -211 - 150 307 1,431 5,924 3,524 18,280 27.555 30,204 29,573 46,730 18,540 Prepaid expenses and other 1,941 1,441 2,224 1,909 1.588 1,774 2,960 1,473 3,625 2,958 4,889 5,160 7.796 8,143 8,267 8,044 7,787 9,240 7,158 6,464 Total current assets 57,689 60,239 63,278 61,185 59,940 54,975 51,893 48,032 64,491 45,996 53,289 62,800 62,609 51,436 72,836 73,107 76,502 81,884 97,295 78,225 6,353 5,513 4,617 5,065 4,800 5,582 5,101 4,866 2,240 1,674 1.770 1,949 2,961 3,002 3,855 Land 26,026 25,659 25,722 25,098 24,045 22,475 21,545 19,988 26,931 18,748 27,138 27,222 27,231 27,302 27,582 27,209 26,347 25,747 31,267 22,949 Buildings and improvements 117,567 115,907 116,194 113,373 108,615 101 526 97,323 90,290 121,653 84,688 117,116 113,701 115,719 135,179 122,624 116,330 97,810 93,400 121,536 87,447 Computer Fixtures and hardware and equipment software 23,334 10,770 23,005 10,617 23,061 10,644 22,502 10,385 21,557 9,950 20,150 9,300 19,316 17,920 8,271 24,145 16,808 7,758 24,458 11,782 23,764 11,631 23,760 11,347 23,107 10,644 23,831 11,409 22,849 10,969 21.951 11,258 21.080 11,444 34,105 12,406 24,829 9,504 2016 Right of use asset operating net 0 0 O 0 0 Construction- in progress 1.795 1,770 1,774 1,731 1,658 1,550 1.486 2,478 3,457 1.993 889 1,400 1,884 3,364 5,227 4,280 2.520 2,331 3,083 1.544 Less accumulated Property and depreciation equipment, net Goodwill -71,782 107,710 17,037 -66,787 110,171 16,695 -63,115 114,280 18,102 -57,725 115,364 19,510 -51,896 113,929 20,497 -45,399 109,603 20,651 -43,486 105,098 16,763 -38,304 99,544 15,026 -54,733 130,998 21,028 -36,288 93,007 13,524 -77,391 103,991 -72,204 105,515 3,760 -67,138 112,804 5,391 -62,516 137,082 4,921 -59,160 131,513 4,987 -55,031 126,605 4,587 -51,356 108,530 4,440 -46,600 107,303 3,684 -65,861 134,936 3,883 -45,057 100,515 2,210 0 0 4,015 4,513 3,412 0 Right of use asset finance, net 0 0 0 0 0 0 0 1,503 1,671 1,777 0 0 0 0 0 0 0 2,812 3,011 3,034 Total Property under investments in equity noncurrent capital lease securities assets 6,468 9,921 141, 136 6,345 6,131 139,342 2,375 5,671 140,428 2,543 6,149 143,566 2,752 5,987 143,165 2,721 5,456 138,431 2,780 4,129 128,770 0 3,942 122,375 0 4,786 160,963 0 3,423 113,905 5,498 102 113,071 5,330 1,231 116,142 2,256 309 121.409 2,340 2,236 146,578 2,504 2,219 141,222 2,612 334 134,138 2,502 2,270 117,742 0 1,556 116,040 0 1,322 143,844 0 578 106,571 Average total Average fored Total assets assets assets 198 825 193,640 107,708 199,581 199,203 108,931 203,706 201,644 112,237 204,751 204,229 114,825 203, 105 203,928 114,641 193,406 198,256 111,765 180,663 187,035 107,341 170,407 175,535 102,328 225,454 197,930 115,278 159,901 192,677 112,016 166,360 149,505 98,491 178,942 172,651 104,737 184,018 181,480 109,147 198,013 191,016 124,919 214,058 206,036 134,288 207,244 210,651 129,057 194,244 200,744 117,548 197,924 196,084 107,903 241,139 219,532 121,102 184,796 212,967 117,729 3,480 OOOOO 0 4,030 4,022 3,875 Accrued income 921 Current portion of long-term debt 2,194 2,560 3,903 3,375 4,547 1,737 Accounts payable 23,102 20,330 25,690 19,492 9,765 20,147 18,005 10,329 15,197 14,061 24,651 17,929 22,319 15,835 19,813 19,158 20,019 20,724 22,172 20,521 Accrued liabilities 20,654 19,607 19,152 18,793 18,808 18,180 18,701 18,734 23,894 18,200 16,609 22,189 14,544 19,822 22,913 28, 116 6,997 12,977 14,130 5,522 521 1,021 966 2,211 1,164 157 1,347 243 984 810 458 898 850 1,946 1,024 1,341 1,185 214 866 Current liabilities of discontinued Current portion operations capital lease 720 0 698 0 313 89 335 0 363 0 361 47 378 92 0 99 0 102 0 0 396 0 384 0 172 0 184 65 200 102 199 188 208 81 0 87 0 90 0 Current portion of Current portion of lease liability lease liability finance lease operating lease 0 0 0 0 0 0 0 0 0 0 0 0 0 342 684 445 650 506 606 0 0 0 0 0 0 0 0 0 0 0 0 0 0 301 602 392 583 400 533 3,831 3.370 4,674 2.678 1,931 2,253 3,435 2.970 4,001 1,529 2,977 2,966 4,113 2,357 Short-term borrowings 1,099 2,708 1,592 7,670 6,805 4,047 1,031 523 914 210 988 1,136 2,098 1,598 1,009 2,014 1,198 1,671 929 1,439 Total current Refund liability liabilities 18.238 66,928 18,195 64,619 13,601 65,272 18,625 69,345 29,319 71,818 16,664 62,300 16,334 58,484 20,122 55,543 26,615 72,730 14,582 51.928 11,095 56,480 11,749 56,098 8,694 52,160 15,528 56,787 12,413 62,360 11,326 63,498 11,828 44,756 9,835 50,342 9,330 51,950 10,581 42,308 Long-term debt 36,015 38,214 41,086 41,771 38,394 44,070 40,692 30,378 47,637 28,102 47,695 53,697 59,608 58,269 67,935 63,373 70,472 66,748 86,335 61,412 5.108 317 Capital lease liability 6,003 5,816 2,606 2,788 3,023 3,009 3,150 0 0 0 5,283 5,118 2,293 2.453 2,660 2,648 2,772 0 Lease liability - Lease liability operating lease finance lease 0 0 0 0 0 0 0 0 0 0 0 0 0 0 6,215 3,108 5,313 3,110 4,017 3,305 0 0 0 0 0 0 0 0 0 0 0 0 0 0 2,767 3,971 2,929 3,807 2,993 Deferred income taxes 9,344 7,321 8,805 9,508 8,536 8,421 8,425 5,024 6,145 6,253 8,223 6,442 7,748 8,367 Total noncurrent liabilities 51,362 51,351 52,497 54,067 49,953 55,500 52,267 44,725 62,205 41,677 61,200 65,258 69,649 69,089 78,107 73,431 80,658 79,373 99,156 73,358 Total liabilities (Cur+ noncur) 118,290 115,970 117,769 123,412 121,771 117,800 110,751 100,268 134,935 93,605 117,680 121,356 121,809 125,876 140,467 136,929 125,413 129,716 151, 106 115,666 Common Additional paid- stock in capital 305 5,436 323 6,914 323 7,455 332 7,766 342 6,817 352 5,076 378 4,551 365 5,377 373 4,138 204 25,160 222 23,769 236 21,773 236 19,867 17,444 249 15,498 262 14,716 276 12,973 274 16,728 278 10,942 Retained earnings 89,354 90,021 85,777 76,566 72,978 68,691 63,967 66,357 84,645 62,433 26,151 36,391 42,862 55,996 58,467 57,596 56,436 57,542 68,878 59,103 Accumulated other comprehensive income(loss) -14,232 12,163 -7,077 -3,005 258 -244 517 - 1,147 133 -648 -2,836 -2,796 -2,662 -3,960 -2.560 -3,027 -2,582 -2,582 4,154 - 1,193 Total shareholders equity 80,535 83,611 85,937 81,339 81,334 75,606 69,912 70,139 90,520 66,296 48,680 57,587 62,209 72,138 73,591 70,316 68,831 68,209 90,034 69,130 Total liabilities and equity 198,825 199,581 203,706 204,751 203,105 193,406 180,663 170,407 225,454 159,901 166,360 178,942 184,018 198,013 214,058 207,244 194,244 197,924 241,139 184,796 240 7,512 7,410 7.414 4,034 5,824 0 0 5,921 5,146 Accrued income taxes (CF) Dividends pald -6,306 492 Accounts payable (CF) 3,942 2,008 2,678 531 1,061 2,687 2,676 1,052 2.970 707 166 -1,224 981 994 -153 0 0 -282 0 0 0 0 0 684 2,347 5,267 1.267 3,697 Accrued liabilities (CF) 1,137 1,303 1,249 103 271 -935 -280 1,348 -725 985 1,876 0 1,267 1.978 0 0 0 0 (CF)-Cash & cash (CF)-Cash & cash equivalents, beginning of equivalents, end of Change in accounts Deferred income year year receivable taxes (CF) 8,705 6,867 0 761 9,135 8,705 0 -672 7,281 9,135 -89 -503 7,781 7,281 -698 -279 6,550 7,781 0 - 133 7,395 6,550 0 1,050 7,907 7,395 651 7,275 7,907 44 9,509 8,869 350 439 6,557 7,151 -1,295 17,982 7,257 761 5,362 9,822 4,870 -672 8,060 3,089 7,727 -503 10,884 3,484 10,123 -279 11,973 3,529 8,859 3,733 7,609 9,929 1,050 0 9,778 8,501 651 0 3,840 7,907 -504 0 10,556 8.419 439 2,356 6,200 -756 Depreciation and amortization (CF) 10,080 9,454 9,173 8,870 8,478 8,130 7,641 7,157 9,176 6,446 302 187 4,862 -2,133 -3,493 -1,169 0 0 0 0 -8,029 -6,435 -5,493 -5,048 4,437 -4,217 -5,921 -4,246 -5,991 -6,053 -5,356 -4,471 -3,862 -3,333 -2,707 -2,204 -5,050 -3,326 Income from continuing operations 14,293 15,080 16,814 16,551 17,704 16,454 15,959 17,703 19,199 13,500 12,164 14,947 -7,271 8,760 13,329 13,018 12,978 11,058 14,556 9,141 Inventories (CF) 1,021 -703 -1,229 -1,667 -2,759 -3,727 -3,205 2,213 4,381 1,798 182 -1,431 31 258 298 1,649 1.978 1,618 806 267 -2,756 0 - 1,738 -716 0 0 0 0 0 0 Other investing activities -122 Investment and usiness acquisitions, met of cash acquired 2,463 0 0 0 0 -3,548 -202 0 0 0 124 191 -7,133 5,689 -8,551 -480 -209 0 Net (decrease) / increase Net cash flows in cash and cash from financing equivalents activities -1,838 -19,381 -430 -17,144 1,854 -15,585 -500 -11,231 1,231 -11,723 -845 -8,491 -512 -11,962 632 -16,738 -640 -11,370 594 -9,491 -10,725 -28,667 -4,952 -42,001 4,638 -7,158 6,638 -34,668 5,330 -6,546 2,320 -22,569 -1,276 -27,058 4,067 -21,551 -2,137 -27,226 3,844 -15,688 Net cash flows from investing Net cash flows from activities operating activities -13,987 31,530 -10,675 27,389 -11,125 28,564 -12 526 23,257 -12,637 25,591 -16,609 24,255 12,193 23,643 11,620 28,990 -16,114 26,843 -11,769 21,854 -6,218 24,160 10,822 26,227 -7,756 19,551 12,867 28,440 -10,813 22,689 836 24,053 24,071 116 25,502 -2,861 27,950 -3,651 23,183 Net change in short-term borrowings -1,673 1,235 -6,288 911 2,754 3,019 503 -1,033 254 -1,253 0 0 -356 -3,956 4,311 0 0 Other financing activities -707 -1,535 -923 -702 165 -630 -568 -3,725 4.748 4,151 -4,236 -21,423 -2,722 -6,384 4,441 - 13,084 -9,214 -8.920 3,413 1,199 -192 - 138 -271 131 219 -438 -101 -694 -6,547 2,173 -1.427 -6,893 -4,138 0 0 13 -1,928 - 1,241 Other operating activities 206 1,410 785 938 602 398 1,087 318 984 17 3,771 6,709 9,462 8,871 9,084 9,471 6,284 7.102 10,900 9,686 Payments for property and equipment -10,619 -11,477 -12,174 -13,115 -12,898 -13,510 -12,699 -12,184 -16,249 -11,735 204 124 422 311 293 164 307 190 287 215 1,711 0 0 0 Payments of long-term debt (CF) Accounts Receivables, Less net 2,055 4,432 3.904 -4,968 -1.478 -4,584 -4,080 -6,033 -5,475 -5,953 -11,738 -378 -9,240 -15,391 -6,796 - 13,889 -10,040 -8.946 -14,504 -9,699 Proceeds from disposal of property and equipment 1.118 881 1,241 727 532 580 489 1,002 236 660 0 8,333 0 13,880 1,129 1.151 1,613 147 -1,283 -1,115 Proceeds from issuance of long- term debt 137 39 5,174 7,072 211 5,050 11,396 5.546 13,870 4,931 8,787 0 8,858 0 2,093 15,529 Purchase of available for sale Securities -1,901 0 0 0 0 0 0 0 0 0 0 0 471 578 453 0 0 0 0 0 Purchase of Treasury stock -8.298 -4,112 1,015 -6,683 -7,600 -6.298 -14,776 -7,276 -18,845 -7,121 - 16,471 -15,480 0 -6,493 -8,333 -8,187 -10,898 -1,880 -15,289 -3,021 -19 -569 -566 -614 -796 -733 -297 -818 -561 502 511 316 471 453 400 484 458 422 391 Stock option exercises -479 -719 -600 426 -282 0 0 0 0 0 982 1,333 1,658 2,027 1,600 396 1,307 209 Cost of sales 361,256 360,984 365,086 358,069 352,297 335,127 314,946 304,444 393,308 285,895 225,530 228,284 231,822 287,872 291,436 279,240 266,435 257,502 336,381 244,558 Sales revenue 572,852 567,419 578,167 560,083 544,518 514,401 485,992 479,084 627,955 446,296 341,836 358,908 355,163 352,340 356,546 344,654 344,188 327,881 415,012 320,982 Credit card revenue 4,556 3,516 3,422 3,218 3,047 3,096 2,897 2,953 3,246 2,494 0 0 0 0 5,960 6,218 7.129 8,542 7,244 6,776 Less Sales Discount returns on Sales -36,099 -55,436 43,883 44,922 43,883 -52,055 42,104 44,903 -38,095 40,819 -37,728 -32,819 41,057 -25,983 40,108 -33,844 -52,332 -51.933 41,860 -23,612 -30,981 -1.988 -28,776 -2,199 -32,047 -370 -32,052 -3,493 -34,221 -2,503 -36,966 -3,394 43,507 -8,299 -39,182 -6,766 -43,879 -7,321 -47,930 -9,288 Net sales 485,873 482,130 485,651 476,294 468,651 446,950 421,849 408,085 526,936 383,318 308,867 327,933 322,747 316,796 325,782 310,511 299,511 290,476 371,056 270.540 Depreciation and amortization 4,211 4,411 4,292 4,160 4,007 4104 3,948 3,828 4,074 3,433 6,355 9,836 9,462 8,871 9,084 9,471 9,262 8,991 9,911 7,198 0 3,950 0 -1,057 Discontinued operations, net of tax 0 0 285 144 52 -67 1,034 -79 918 3,555 302 187 -18,156 -3,213 -1,404 0 0 0 0 EBIT 18,230 19,173 22,555 22,449 23,446 22,166 21,317 22,896 27,969 22,011 17,622 21,880 16,236 18,315 22,471 19,818 19,991 17,222 21,652 13,683 Gain on sale 323 521 300 263 272 288 277 278 260 220 0 -2,756 0 -1,738 -716 0 0 0 0 0 Gross margin 124,617 121,146 120,565 118,225 116,354 111,823 106,903 103,641 133,629 97,423 83,337 99,649 90,924 28,924 34,347 31,271 33,076 32,973 34,674 25,982 Income from continuing operations 12,026 12,615 14,570 14,344 15,488 14,222 13,738 15,740 18,870 15,566 11,862 14,760 10,884 11,973 14,733 13,005 12,934 10,949 14,501 8,953 Interest income 2,267 2,469 2,529 2,351 2,268 2,165 3,255 1,884 1,246 1,489 0 0 0 0 0 13 44 109 55 188 Net income / (loss) 14,293 15,080 16,814 16,551 17,704 16,454 15,959 17,703 19,199 13,500 12,164 14,947 -7,271 8,760 13,329 13,018 12,978 11,058 14,556 9,141 Provision Selling, general for and income administrative taxes expenses 6,204 101,853 6,558 97,041 7,985 93,418 8,105 91,353 7,958 88,629 7,944 85,265 7,579 81,361 7,156 76,639 9,099 101,326 6,445 71,759 5,760 59,360 7,120 65,178 5,351 65,227 6,342 0 7,738 2,076 6,787 1,982 7,000 3,822 6,151 6,760 7,083 3,111 4,529 5,101 Interest expense 2102 2239 2446 2456 2338 2493 2425 1841 2849 1706 3101 3493 3919 3808 4472 4036 4567 4341 5632 3998 0