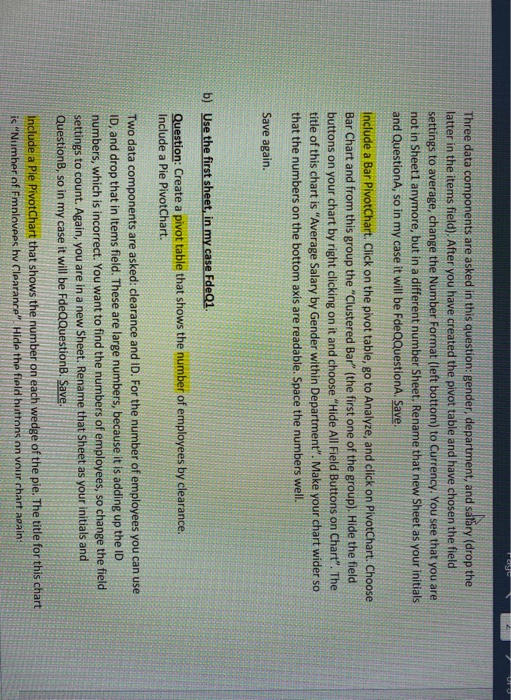
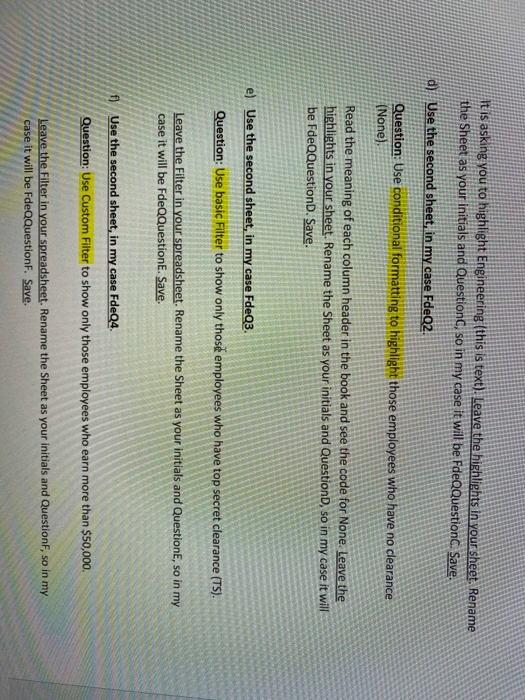
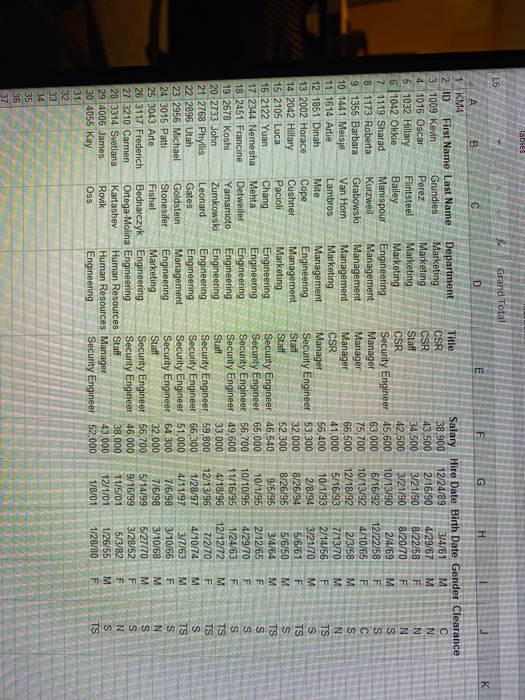
Three data components are asked in this question:gender, department, and salary (drop the latter in the items field). After you have created the pivot table and have chosen the field settings to average, change the Number Format (left bottom) to Currency. You see that you are not in Sheet1 anymore, but in a different number Sheet. Rename that new Sheet as your initials and QuestionA, so in my case it will be FdeQQuestionA. Save Include a Bar PivotChart. Click on the pivot table, go to Analyze, and click on PivotChart. Choose Bar Chart and from this group the "Clustered Bar" (the first one of the group). Hide the field buttons on your chart by right clicking on it and choose "Hide All Field Buttons on Chart". The title of this chart is "Average Salary by Gender within Department". Make your chart wider so that the numbers on the bottom axis are readable. Space the numbers well. Save again. b) Use the first sheet in my case Fde01. Question: Create a pivot table that shows the number of employees by clearance. Include a Pie PivotChart. Two data components are asked: clearance and ID. For the number of employees you can use ID, and drop that in Items field. These are large numbers, because it is adding up the ID numbers, which is incorrect. You want to find the numbers of employees, so change the field settings to count. Again, you are in a new Sheet. Rename that Sheet as your initials and Questions, so in my case it will be FdeQQuestionB. Save. Include a Pie PivotChart that shows the number on each wedge of the pie. The title for this chart is "Number of Emplovees hy Clearance" Hide the field buttons on vour chart again: It is asking you to highlight Engineering (this is text). Leave the highlights in your sheet. Rename the Sheet as your initials and Question, so in my case it will be FdeQQuestion Save. d) Use the second sheet in my case FdeQ2. Question: Use conditional formatting to highlight those employees who have no clearance (None) Read the meaning of each column header in the book and see the code for None. Leave the highlights in your sheet. Rename the Sheet as your initials and Question, so in my case it will be FdeQQuestionD. Save. e) Use the second sheet, in my case FdeQ3. Question: Use basic Filter to show only those employees who have top secret clearance (TS). Leave the Filter in your spreadsheet. Rename the Sheet as your initials and Question, so in my case it will be FdeQQuestion E. Save. ) Use the second sheet, in my case FdeQ4. WWWWWWWWWWWW Question: Use Custom Filter to show only those employees who earn more than $50,000. W Leave the Filter in your spreadsheet. Rename the Sheet as your initials and QuestionF, so in my case it will be FdeQQuestionF. Save. Grand Total LO Title ZZZ 1 KM 2 ID First Name Last Name Department Salary Hire Date Birth Date Gender Clearance 3 1009 Kevin Grundies Marketing CSR 38,900 12/24/89 3/4/61 41016 Oscar Perez Marketing CSR 43,5002/16/904/29/67M 5 1032 Hillary Flintsteel Marketing Staff 34,5003/21/908/22/58 F 6 1042 Okkie Bailey Marketing CSR 42,5003/21/90 8/20/70F 7 1119 Sharad Manispour Engineering Security Engineer 45,600 10/13/90 24/69M 8 1173 Roberta Kurzweil Management Manager 63,000 6/16/92 12/22/58 F 9 1355 Barbara Grabowski Management Manager 75,700 10/13/92 4/10/65 10 1441 Meisje Van Horn Management Manager 66,500 12/18/92 2 /3/58 M 11 1614 Artie Lambros Marketing CSR 41,000 5/16/93 7/13/70 M 12 1851 Dinah Mite Management Manager 56,400 10/1/932/14/56 13 2002 Horace Cope Engineering Security Engineer 53,300 2/8/94 3/21/70 14 2042 Hillary Cushner Management Staff 32,0008/26/94 5/6/61 15 2105 Luca Pacioli Marketing Staff 52.300 8/26/95 5/6/50 M 16 2122 Yuan Chang Engineering Security Engineer 46,540 9/5/95 3/4/64 17 2344 Nemesha Mehta Engineering Security Engineer 65,000 10/1/952/12/65 18 2451 Francine Detweiler Engineering Security Engineer 56,700 10/10/954 /29/70 F 19 2678 Koshi Yamamoto Engineering Security Engineer 49,600 11/16/951/24/63 F 20 2733 John Zumkowski Engineering Staff 33,000 4 /18/96 12/12/72 M 21 2768 Phyllis Leonard Engineering Security Engineer 59,800 12/13/96 7/2/70F 22 2896 Utah Gates Engineering Security Engineer 66,3001/28/974/10/74 M 23 2956 Michael Goldstein Management Security Engineer 51,000 4/11/973 /7/63M 24 3015 Patti Stonesifer Engineering Security Engineer 64,300 7 /6/983 /10/66 F 25 3043 Arte Fishel Marketing Staff 32,000 7/6/98 3/10/68 M 26 3117 Frederich Bednarczyk Engineering Security Engineer 56,700 5 /14/99 5/27/70 M 27 3210 Carmen Ortega-Molina Engineering Security Engineer 46,000 9/16/993/28/52F 28 3314 Svetlana Kartashev Human Resources Staff 38,000 11/5/015/3/82 29 4006 James Rovik Human Resources Manager 43.000 12/1/01 1/26/55 M 30 4055 Kay O ss Engineering Security Engineer 52,000 1/8/01 1/28/80F 31 32 33 RO 220 220 2200 zon 202 LOUR SELECT Three data components are asked in this question:gender, department, and salary (drop the latter in the items field). After you have created the pivot table and have chosen the field settings to average, change the Number Format (left bottom) to Currency. You see that you are not in Sheet1 anymore, but in a different number Sheet. Rename that new Sheet as your initials and QuestionA, so in my case it will be FdeQQuestionA. Save Include a Bar PivotChart. Click on the pivot table, go to Analyze, and click on PivotChart. Choose Bar Chart and from this group the "Clustered Bar" (the first one of the group). Hide the field buttons on your chart by right clicking on it and choose "Hide All Field Buttons on Chart". The title of this chart is "Average Salary by Gender within Department". Make your chart wider so that the numbers on the bottom axis are readable. Space the numbers well. Save again. b) Use the first sheet in my case Fde01. Question: Create a pivot table that shows the number of employees by clearance. Include a Pie PivotChart. Two data components are asked: clearance and ID. For the number of employees you can use ID, and drop that in Items field. These are large numbers, because it is adding up the ID numbers, which is incorrect. You want to find the numbers of employees, so change the field settings to count. Again, you are in a new Sheet. Rename that Sheet as your initials and Questions, so in my case it will be FdeQQuestionB. Save. Include a Pie PivotChart that shows the number on each wedge of the pie. The title for this chart is "Number of Emplovees hy Clearance" Hide the field buttons on vour chart again: It is asking you to highlight Engineering (this is text). Leave the highlights in your sheet. Rename the Sheet as your initials and Question, so in my case it will be FdeQQuestion Save. d) Use the second sheet in my case FdeQ2. Question: Use conditional formatting to highlight those employees who have no clearance (None) Read the meaning of each column header in the book and see the code for None. Leave the highlights in your sheet. Rename the Sheet as your initials and Question, so in my case it will be FdeQQuestionD. Save. e) Use the second sheet, in my case FdeQ3. Question: Use basic Filter to show only those employees who have top secret clearance (TS). Leave the Filter in your spreadsheet. Rename the Sheet as your initials and Question, so in my case it will be FdeQQuestion E. Save. ) Use the second sheet, in my case FdeQ4. WWWWWWWWWWWW Question: Use Custom Filter to show only those employees who earn more than $50,000. W Leave the Filter in your spreadsheet. Rename the Sheet as your initials and QuestionF, so in my case it will be FdeQQuestionF. Save. Grand Total LO Title ZZZ 1 KM 2 ID First Name Last Name Department Salary Hire Date Birth Date Gender Clearance 3 1009 Kevin Grundies Marketing CSR 38,900 12/24/89 3/4/61 41016 Oscar Perez Marketing CSR 43,5002/16/904/29/67M 5 1032 Hillary Flintsteel Marketing Staff 34,5003/21/908/22/58 F 6 1042 Okkie Bailey Marketing CSR 42,5003/21/90 8/20/70F 7 1119 Sharad Manispour Engineering Security Engineer 45,600 10/13/90 24/69M 8 1173 Roberta Kurzweil Management Manager 63,000 6/16/92 12/22/58 F 9 1355 Barbara Grabowski Management Manager 75,700 10/13/92 4/10/65 10 1441 Meisje Van Horn Management Manager 66,500 12/18/92 2 /3/58 M 11 1614 Artie Lambros Marketing CSR 41,000 5/16/93 7/13/70 M 12 1851 Dinah Mite Management Manager 56,400 10/1/932/14/56 13 2002 Horace Cope Engineering Security Engineer 53,300 2/8/94 3/21/70 14 2042 Hillary Cushner Management Staff 32,0008/26/94 5/6/61 15 2105 Luca Pacioli Marketing Staff 52.300 8/26/95 5/6/50 M 16 2122 Yuan Chang Engineering Security Engineer 46,540 9/5/95 3/4/64 17 2344 Nemesha Mehta Engineering Security Engineer 65,000 10/1/952/12/65 18 2451 Francine Detweiler Engineering Security Engineer 56,700 10/10/954 /29/70 F 19 2678 Koshi Yamamoto Engineering Security Engineer 49,600 11/16/951/24/63 F 20 2733 John Zumkowski Engineering Staff 33,000 4 /18/96 12/12/72 M 21 2768 Phyllis Leonard Engineering Security Engineer 59,800 12/13/96 7/2/70F 22 2896 Utah Gates Engineering Security Engineer 66,3001/28/974/10/74 M 23 2956 Michael Goldstein Management Security Engineer 51,000 4/11/973 /7/63M 24 3015 Patti Stonesifer Engineering Security Engineer 64,300 7 /6/983 /10/66 F 25 3043 Arte Fishel Marketing Staff 32,000 7/6/98 3/10/68 M 26 3117 Frederich Bednarczyk Engineering Security Engineer 56,700 5 /14/99 5/27/70 M 27 3210 Carmen Ortega-Molina Engineering Security Engineer 46,000 9/16/993/28/52F 28 3314 Svetlana Kartashev Human Resources Staff 38,000 11/5/015/3/82 29 4006 James Rovik Human Resources Manager 43.000 12/1/01 1/26/55 M 30 4055 Kay O ss Engineering Security Engineer 52,000 1/8/01 1/28/80F 31 32 33 RO 220 220 2200 zon 202 LOUR SELECT