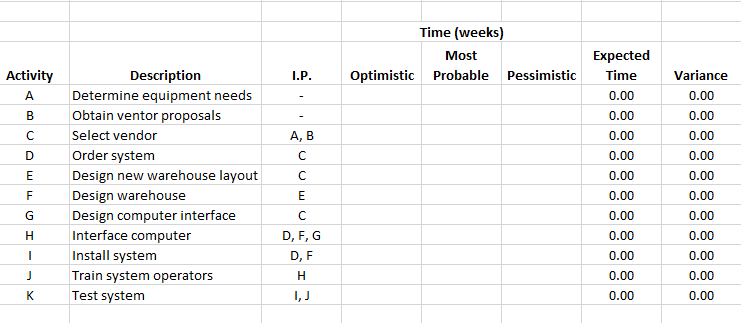
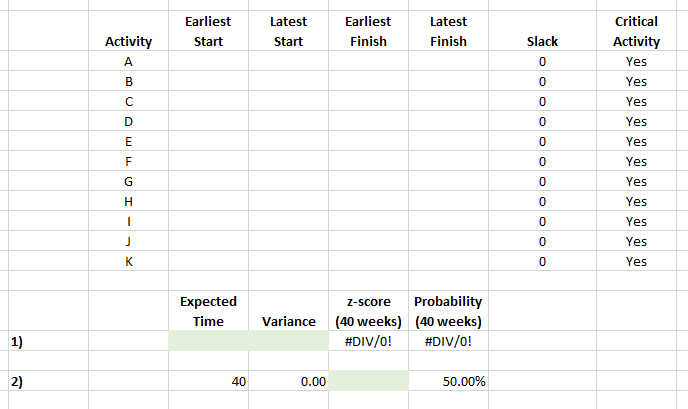
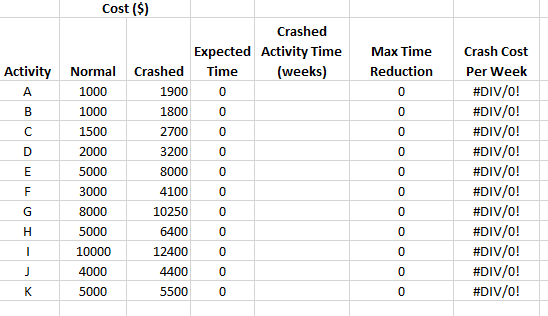
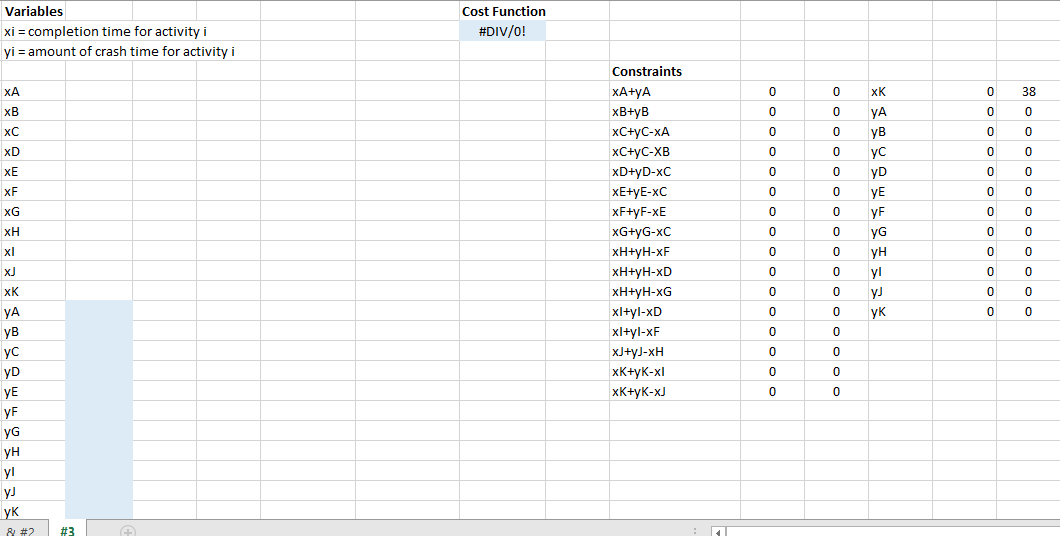
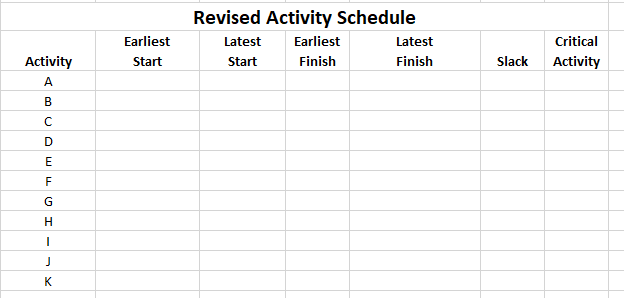
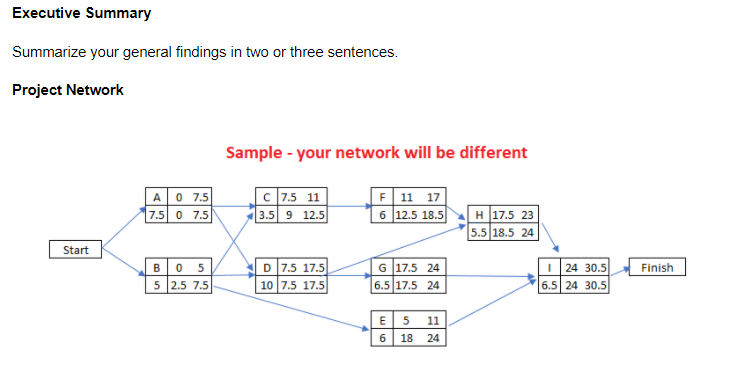
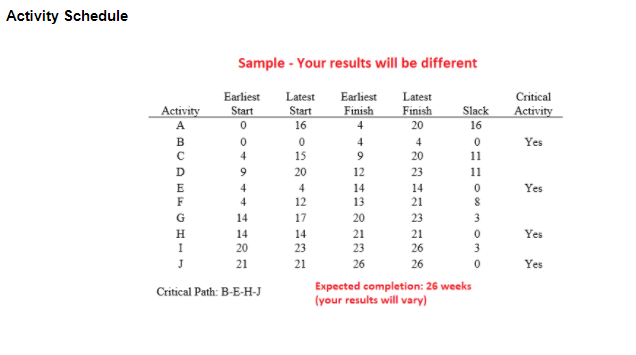
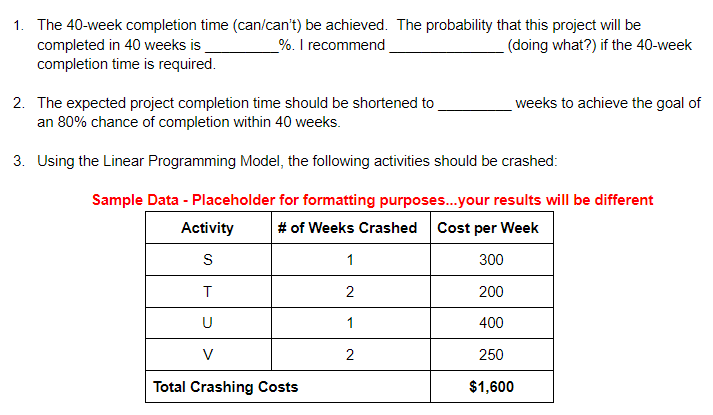
Time (weeks) Most Optimistic Probable Pessimistic I.P. Activity A Expected Time 0.00 0.00 0.00 Variance 0.00 0.00 0.00 B C D A,B C 0.00 E 0.00 Description Determine equipment needs Obtain ventor proposals Select vendor Order system Design new warehouse layout Design Warehouse Design computer interface Interface computer Install system Train system operators Test system F E 0.00 0.00 0.00 0.00 0.00 0.00 0.00 G 0.00 H 0.00 . D, F, G D, F H 0.00 0.00 J 0.00 0.00 K 0.00 Latest Earliest Start Earliest Finish Latest Finish Start Slack Activity A Critical Activity Yes Yes 0 0 0 Yes - 0 Yes 0 Yes 0 Yes 0 Yes H 0 Yes I 0 Yes J Yes O O K Yes Expected Time z-score Probability Variance (40 weeks) (40 weeks) #DIV/0! #DIV/0! 1) 2) 40 0.00 50.00% Max Time Reduction 0 0 0 Cost ($) Crashed Expected Activity Time Activity Normal Crashed Time (weeks) A 1000 1900 0 B 1000 1800 0 C 1500 2700 0 D 2000 3200 0 E 5000 8000 0 F 3000 4100 0 G 8000 10250 0 H 5000 6400 0 I 10000 12400 0 J 4000 4400 0 K 5000 5500 0 0 0 Crash Cost Per Week #DIV/0! #DIV/0! #DIV/0! #DIV/0! #DIV/0! #DIV/0! #DIV/0! #DIV/0! #DIV/0! #DIV/0! #DIV/0! 0 0 0 0 0 O Variables xi = completion time for activity i yi = amount of crash time for activity i Cost Function #DIV/0! XA 0 0 xK 0 38 0 0 0 0 0 0 0 0 xD 0 0 0 0 XE 0 0 0 0 XF 0 0 0 0 XG 0 0 yB yD yE yF yG yl y] 0 0 Constraints XA+YA xB+yB XC+yC-XA XC+yC-XB XD+yD-C XE+yE-xC XF+yF-XE XG+yG-XC xH+yH-F xH+yH-XD xH+yH-xG xl+yl-xD XI+yl-xF XJ+y)-xH xK+yK-XI xK+yK-xJ xH 0 0 0 0 xl 0 0 0 0 XJ 0 0 0 0 xK 0 0 0 0 0 0 0 0 YA 0 0 0 0 0 0 0 0 yD YE yF yG yl yJ #2 #3 Earliest Start Revised Activity Schedule Latest Earliest Latest Start Finish Finish Critical Activity Slack Activity A B C D . 1 J K Executive Summary Summarize your general findings in two or three sentences. Project Network Sample - your network will be different A O 7.5 7.5 0 7.5 C 7.5 11 3.5 9 12.5 F 11 17 6 12.5 18.5 H 17.5 23 5.5 18.5 24 Start Finish BO 5 5 2.5 7.5 D 7.5 17.5 10 7.5 17.5 G 17.5 24 6.5 17.5 24 124 30.5 6.5 24 30.5 E 6 5 18 11 24 Activity Schedule Critical Activity Yes Sample - Your results will be different Earliest Latest Earliest Latest Activity Start Start Finish Finish Slack 0 16 20 16 B 0 0 4 4 0 4 15 9 20 11 D 9 20 12 23 11 E 4 4 14 14 0 F 4 12 13 21 8 14 17 20 23 3 H 14 14 21 21 0 1 20 23 23 26 3 J 21 21 26 26 0 Critical Path: B-E-H- Expected completion: 26 weeks (your results will vary) Yes Yes Yes 1. The 40-week completion time (can/can't) be achieved. The probability that this project will be completed in 40 weeks is %. I recommend (doing what?) if the 40-week completion time is required. weeks to achieve the goal of 2. The expected project completion time should be shortened to an 80% chance of completion within 40 weeks. 3. Using the Linear Programming Model, the following activities should be crashed: Sample Data - Placeholder for formatting purposes...your results will be different Activity # of Weeks Crashed Cost per Week S 1 300 T 2 200 U 1 400 V 2 250 Total Crashing Costs $1,600 Revised Activity Schedule Placeholder - include a screenshot of your data Revised Activity Schedule Earliest Latest Earliest Latest Start Start Finish Finish Slack Critical Activity Activity B C D E F G H 1 J K Time (weeks) Most Optimistic Probable Pessimistic I.P. Activity A Expected Time 0.00 0.00 0.00 Variance 0.00 0.00 0.00 B C D A,B C 0.00 E 0.00 Description Determine equipment needs Obtain ventor proposals Select vendor Order system Design new warehouse layout Design Warehouse Design computer interface Interface computer Install system Train system operators Test system F E 0.00 0.00 0.00 0.00 0.00 0.00 0.00 G 0.00 H 0.00 . D, F, G D, F H 0.00 0.00 J 0.00 0.00 K 0.00 Latest Earliest Start Earliest Finish Latest Finish Start Slack Activity A Critical Activity Yes Yes 0 0 0 Yes - 0 Yes 0 Yes 0 Yes 0 Yes H 0 Yes I 0 Yes J Yes O O K Yes Expected Time z-score Probability Variance (40 weeks) (40 weeks) #DIV/0! #DIV/0! 1) 2) 40 0.00 50.00% Max Time Reduction 0 0 0 Cost ($) Crashed Expected Activity Time Activity Normal Crashed Time (weeks) A 1000 1900 0 B 1000 1800 0 C 1500 2700 0 D 2000 3200 0 E 5000 8000 0 F 3000 4100 0 G 8000 10250 0 H 5000 6400 0 I 10000 12400 0 J 4000 4400 0 K 5000 5500 0 0 0 Crash Cost Per Week #DIV/0! #DIV/0! #DIV/0! #DIV/0! #DIV/0! #DIV/0! #DIV/0! #DIV/0! #DIV/0! #DIV/0! #DIV/0! 0 0 0 0 0 O Variables xi = completion time for activity i yi = amount of crash time for activity i Cost Function #DIV/0! XA 0 0 xK 0 38 0 0 0 0 0 0 0 0 xD 0 0 0 0 XE 0 0 0 0 XF 0 0 0 0 XG 0 0 yB yD yE yF yG yl y] 0 0 Constraints XA+YA xB+yB XC+yC-XA XC+yC-XB XD+yD-C XE+yE-xC XF+yF-XE XG+yG-XC xH+yH-F xH+yH-XD xH+yH-xG xl+yl-xD XI+yl-xF XJ+y)-xH xK+yK-XI xK+yK-xJ xH 0 0 0 0 xl 0 0 0 0 XJ 0 0 0 0 xK 0 0 0 0 0 0 0 0 YA 0 0 0 0 0 0 0 0 yD YE yF yG yl yJ #2 #3 Earliest Start Revised Activity Schedule Latest Earliest Latest Start Finish Finish Critical Activity Slack Activity A B C D . 1 J K Executive Summary Summarize your general findings in two or three sentences. Project Network Sample - your network will be different A O 7.5 7.5 0 7.5 C 7.5 11 3.5 9 12.5 F 11 17 6 12.5 18.5 H 17.5 23 5.5 18.5 24 Start Finish BO 5 5 2.5 7.5 D 7.5 17.5 10 7.5 17.5 G 17.5 24 6.5 17.5 24 124 30.5 6.5 24 30.5 E 6 5 18 11 24 Activity Schedule Critical Activity Yes Sample - Your results will be different Earliest Latest Earliest Latest Activity Start Start Finish Finish Slack 0 16 20 16 B 0 0 4 4 0 4 15 9 20 11 D 9 20 12 23 11 E 4 4 14 14 0 F 4 12 13 21 8 14 17 20 23 3 H 14 14 21 21 0 1 20 23 23 26 3 J 21 21 26 26 0 Critical Path: B-E-H- Expected completion: 26 weeks (your results will vary) Yes Yes Yes 1. The 40-week completion time (can/can't) be achieved. The probability that this project will be completed in 40 weeks is %. I recommend (doing what?) if the 40-week completion time is required. weeks to achieve the goal of 2. The expected project completion time should be shortened to an 80% chance of completion within 40 weeks. 3. Using the Linear Programming Model, the following activities should be crashed: Sample Data - Placeholder for formatting purposes...your results will be different Activity # of Weeks Crashed Cost per Week S 1 300 T 2 200 U 1 400 V 2 250 Total Crashing Costs $1,600 Revised Activity Schedule Placeholder - include a screenshot of your data Revised Activity Schedule Earliest Latest Earliest Latest Start Start Finish Finish Slack Critical Activity Activity B C D E F G H 1 J K