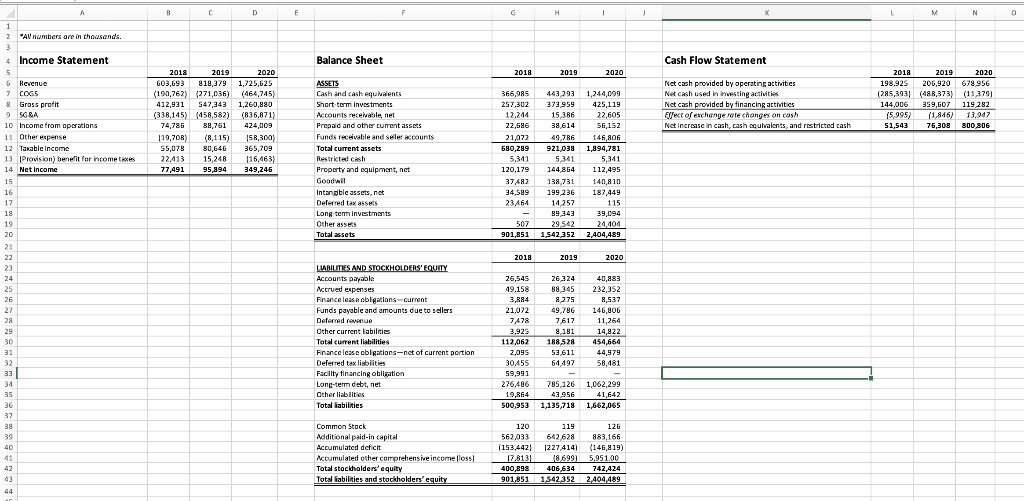
| To answer Q9, please refer to the financial statement information contained in the "Q9 Statements" spreadsheet. | |
| Q9a. Use appropriate measures of your choice to assess this company's operating performance from 2018 to 2020 (5 points). |
| Q9b. Calculate the return on equity (ROE) of the company from 2018 to 2020. Apply the DuPont analysis to explain what drives the return to the company's shareholders (5 points). |
| Q9c. Use appropriate measures of your choice to assess this company's working capital management efficiency (5 points). |
| Q9d. Assume the management is debating whether it is time for the company to start paying dividend. What's your recommendation? Why? (5 points) |
| Q9e. Based on the financial statements, how do you think the pandemic in 2020 affected the company? Please provide specific evidence to support your argument. (5 points) |
A B C D F F G H ! 1 1 M N O 1 2 "A numbers are in thousands. . 3 Income Statement Balance Sheet Cash Flow Statement 2018 2019 2020 366,985 257,302 2018 2019 2020 603,693 819,379 1,725,625 (190,762) 1271,036) (464,745) 412,921 547,343 1,260,880 (338,145) (458,582) (458,582) (836,871) 74,785 88,761 424,009 119,70R) (8,115) 158,300) 55,078 80,646 365,709 22,413 15,248 116,463) 77,491 95,894 349,245 Net cash provided by operating activities Net cash used in investing activities Net cash provided by financing activities Effect of exchange rate changes on cash Net Increase in cash, cash couhvalents, and restricted cash 2018 2019 2020 198,925 206,920 678,956 (285,393) (488,373) (11,379) 144,006 359,607 119,282 15,995) 11,846) 13,947 51,543 76,305 800 806 ASSETS Cash and cash equivalents Short term investments Accounts receivable net Prepaid and other current assets Funds receivable and seller accounts Total current assets Restricted cash Property and equipment, net Goodwil Intangible assets, net Deferred tax assets Long term investments Other assets Total assets 12.244 22,586 21,072 680,289 5,311 120,179 37,482 34,599 23464 - 507 901,851 443 293 373.959 15 386 38 614 49,786 921,038 5,341 144864 138,731 199 236 14.257 89.343 29542 1,542352 1,244,099 425,119 22,605 56,152 146,805 1,994,781 5,341 112,495 140,810 187,449 115 39,094 24,404 2,404,489 2018 2019 2020 6 Revenue 7 COGS 8 Gross profit 9 SG&A 10 Income from operations 11 Other expense 12 Taxable income 13 Provision) benefit for income taxes 14 Net Income 15 16 17 19 19 20 21 22 23 24 25 26 27 28 29 30 31 32 33 34 35 36 37 39 39 40 41 42 43 44 LUABILITIES AND STOCKHOLDERS' EQUITY Accounts payable Accrued expenses Finance lease obligations-current Funds payable and amounts due to sellers Deferred revenue Other current labilities Total current liabilities Finance lease obligations-net of current portion Deferred tax liabilities Facility financing obligation Long-term debt, net Other liabilities Total abilities 26,545 26.324 40,883 49.158 88 345 232,352 3,884 8275 8,537 21.022 49,786 146,806 7,478 7617 11,264 3.925 8,181 14,822 112,062 188,528 454,564 2,095 53611 44,979 30455 64497 58,481 59,991 276486 785 126 1,062,299 19,864 43956 41,642 500,953 1,135,718 1,662,065 Common Stock Additional paid-in capital Accumulated deficht Accumulated other comprehensive income foss! Total stockholders' equity Total liabilities and stockholders' equity 120 119 126 562,033 642.628 883,166 (1534421 1227414) (146.819) 17.8131 18 699) 5.951,00 400,898 406 634 742.424 901,851 1542352 2.404 489 A B C D F F G H ! 1 1 M N O 1 2 "A numbers are in thousands. . 3 Income Statement Balance Sheet Cash Flow Statement 2018 2019 2020 366,985 257,302 2018 2019 2020 603,693 819,379 1,725,625 (190,762) 1271,036) (464,745) 412,921 547,343 1,260,880 (338,145) (458,582) (458,582) (836,871) 74,785 88,761 424,009 119,70R) (8,115) 158,300) 55,078 80,646 365,709 22,413 15,248 116,463) 77,491 95,894 349,245 Net cash provided by operating activities Net cash used in investing activities Net cash provided by financing activities Effect of exchange rate changes on cash Net Increase in cash, cash couhvalents, and restricted cash 2018 2019 2020 198,925 206,920 678,956 (285,393) (488,373) (11,379) 144,006 359,607 119,282 15,995) 11,846) 13,947 51,543 76,305 800 806 ASSETS Cash and cash equivalents Short term investments Accounts receivable net Prepaid and other current assets Funds receivable and seller accounts Total current assets Restricted cash Property and equipment, net Goodwil Intangible assets, net Deferred tax assets Long term investments Other assets Total assets 12.244 22,586 21,072 680,289 5,311 120,179 37,482 34,599 23464 - 507 901,851 443 293 373.959 15 386 38 614 49,786 921,038 5,341 144864 138,731 199 236 14.257 89.343 29542 1,542352 1,244,099 425,119 22,605 56,152 146,805 1,994,781 5,341 112,495 140,810 187,449 115 39,094 24,404 2,404,489 2018 2019 2020 6 Revenue 7 COGS 8 Gross profit 9 SG&A 10 Income from operations 11 Other expense 12 Taxable income 13 Provision) benefit for income taxes 14 Net Income 15 16 17 19 19 20 21 22 23 24 25 26 27 28 29 30 31 32 33 34 35 36 37 39 39 40 41 42 43 44 LUABILITIES AND STOCKHOLDERS' EQUITY Accounts payable Accrued expenses Finance lease obligations-current Funds payable and amounts due to sellers Deferred revenue Other current labilities Total current liabilities Finance lease obligations-net of current portion Deferred tax liabilities Facility financing obligation Long-term debt, net Other liabilities Total abilities 26,545 26.324 40,883 49.158 88 345 232,352 3,884 8275 8,537 21.022 49,786 146,806 7,478 7617 11,264 3.925 8,181 14,822 112,062 188,528 454,564 2,095 53611 44,979 30455 64497 58,481 59,991 276486 785 126 1,062,299 19,864 43956 41,642 500,953 1,135,718 1,662,065 Common Stock Additional paid-in capital Accumulated deficht Accumulated other comprehensive income foss! Total stockholders' equity Total liabilities and stockholders' equity 120 119 126 562,033 642.628 883,166 (1534421 1227414) (146.819) 17.8131 18 699) 5.951,00 400,898 406 634 742.424 901,851 1542352 2.404 489