

Question
* To complete this exercise, you will need to have downloaded and installed Tableau on your computer. * Cena Company (CC) manufactures sporting equipment and
* To complete this exercise, you will need to have downloaded and installed Tableau on your computer. *
Cena Company (CC) manufactures sporting equipment and it provided the following information for its most recent year of operations (all raw materials are used in production as direct materials):
| Purchase of raw materials | $ 45,000 |
|---|---|
| Direct labor | $ 53,000 |
| Manufacturing overhead applied to work in process | $ 68,000 |
| Actual manufacturing overhead cost | $ 68,000 |
Inventory balances at the beginning and the end of the year were as follows:
| Beginning | Ending | |
|---|---|---|
| Raw materials | $ 10,000 | $ 22,500 |
| Work in process | $ 35,000 | $ 69,000 |
| Finished goods | $ 0 | $ 39,500 |
The company has asked you to explain the flow of costs within the Schedules of Cost of Goods Manufactured and Cost of Goods Sold to its senior management team. To aid your explanation, you have decided to create visualization that depicts the flow of these costs.
Download the Excel file, which you will use to create the Tableau visualization that aid your explanation.
Upload the Excel file into Tableau by doing the following:
- Open the Tableau Desktop application.
- On the left-hand side, under the Connect header and the To a file sub-header, click on Microsoft Excel.
- Choose the Excel file and click Open.
- Since the only worksheet in the Excel File is Cena Company it will default as a selection with no further import steps needed.
QUESTIONS: For all questions, you may select more than one answer.
1a. The conversion costs of $121,000 (shown in item 7) contain which of the following costs? Check all that apply.
A) Direct labor + Manufacturing overhead applied to work in process
B) Direct materials used in production + Direct labor
C) Direct materials used in production + Manufacturing overhead applied to work in process
D) Raw material purchases + Manufacturing overhead applied to work in process
1b. Which of the following equations reflects the flow of costs within the three inventory accounts included in the schedules of cost of goods manufactured and cost of goods sold? Check all that apply.
A) Beginning balance Additions Ending balance = Transferred out
B) Beginning balance + Additions Ending balance = Transferred out
C) Beginning balance Additions + Ending balance = Transferred out
D) Beginning balance + Additions + Ending balance = Transferred out
1c. Which of the following statements is true? Check all that apply.
A) The cost of goods manufactured transfers out to cost of goods sold.unanswered
B) The cost of goods manufactured transfers out to raw materials inventory.unanswered
C) The cost of goods manufactured transfers out to finished goods inventory.unanswered
D) The cost of goods manufactured transfers out to work in process inventory.unanswered
1d. The total amount of product costs included in this visualization that would be recorded as an expense in the income statement would be (check all that apply):
A) $80,000unanswered
B) $32,500unanswered
C) $119,500unanswered
D) $199,500unanswered
1e. If the companys actual manufacturing cost had been $70,000 instead of $68,000, what effect would it have had on the cost of goods manufactured (COGM)?
A) It would increase the beginning balance of work in process inventory by $2,000.unanswered
B) It would decrease the cost of goods manufactured (COGM) by $2,000.unanswered
C) It would increase the cost of goods manufactured (COGM) by $2,000.unanswered
D) It would have no effect on the cost of goods manufactured (COGM).
Thank you!
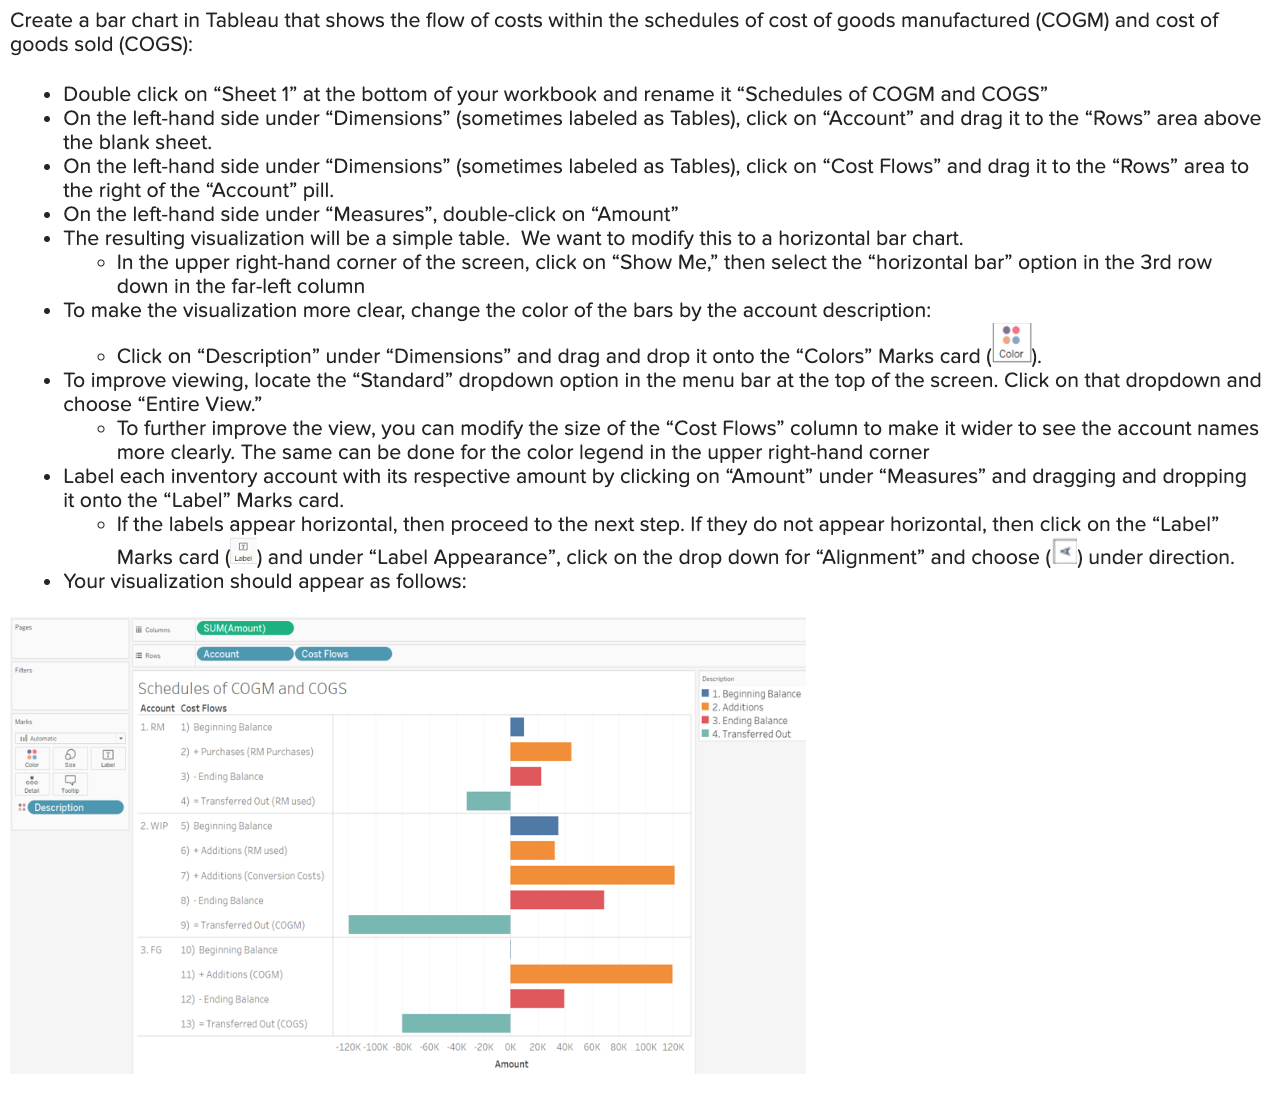
Create a bar chart in Tableau that shows the flow of costs within the schedules of cost of goods manufactured (COGM) and cost of goods sold (COGS): - Double click on "Sheet 1" at the bottom of your workbook and rename it "Schedules of COGM and COGS" - On the left-hand side under "Dimensions" (sometimes labeled as Tables), click on "Account" and drag it to the "Rows" area above the blank sheet. - On the left-hand side under "Dimensions" (sometimes labeled as Tables), click on "Cost Flows" and drag it to the "Rows" area to the right of the "Account" pill. - On the left-hand side under "Measures", double-click on "Amount" - The resulting visualization will be a simple table. We want to modify this to a horizontal bar chart. - In the upper right-hand corner of the screen, click on "Show Me," then select the "horizontal bar" option in the 3rd row down in the far-left column - To make the visualization more clear, change the color of the bars by the account description: - Click on "Description" under "Dimensions" and drag and drop it onto the "Colors" Marks card (Color). - To improve viewing, locate the "Standard" dropdown option in the menu bar at the top of the screen. Click on that dropdown and choose "Entire View." - To further improve the view, you can modify the size of the "Cost Flows" column to make it wider to see the account names more clearly. The same can be done for the color legend in the upper right-hand corner - Label each inventory account with its respective amount by clicking on "Amount" under "Measures" and dragging and dropping it onto the "Label" Marks card. - If the labels appear horizontal, then proceed to the next step. If they do not appear horizontal, then click on the "Label" - Your visualization should appear as followsStep by Step Solution
There are 3 Steps involved in it
Step: 1

Get Instant Access to Expert-Tailored Solutions
See step-by-step solutions with expert insights and AI powered tools for academic success
Step: 2

Step: 3
Ace Your Homework with AI
Get the answers you need in no time with our AI-driven, step-by-step assistance
Get Started
Yes You Can Get A Financial Life
Authors: Ben Stein, Phil Demuth
1st Edition
1401911250, 978-1401911256