

Answered step by step
Verified Expert Solution
Question
1 Approved Answer
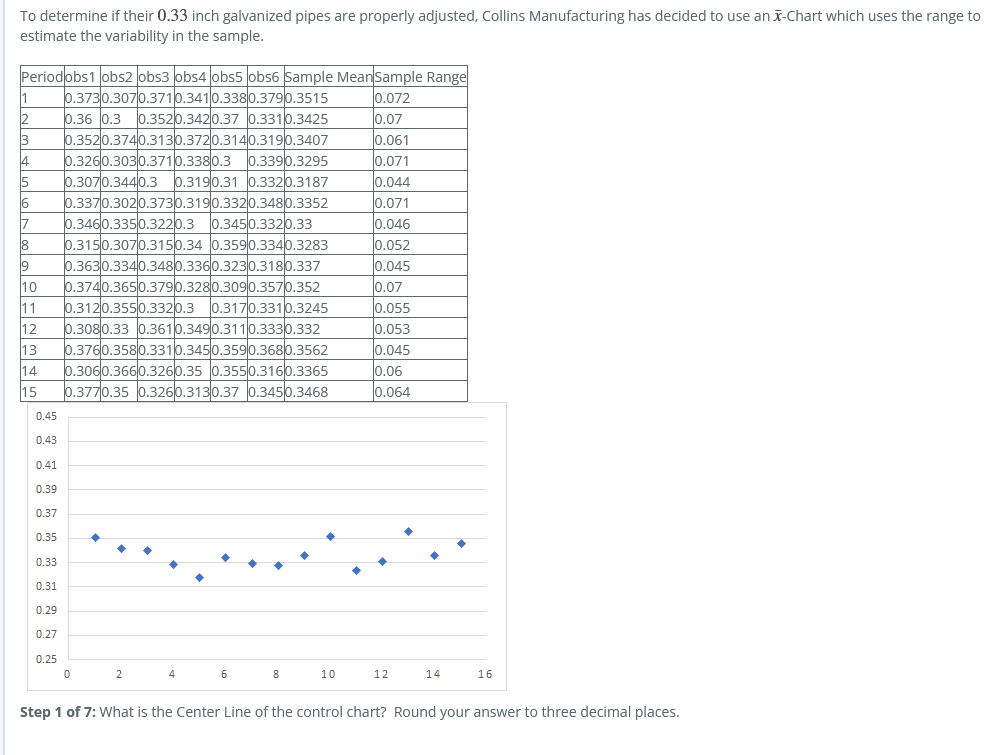
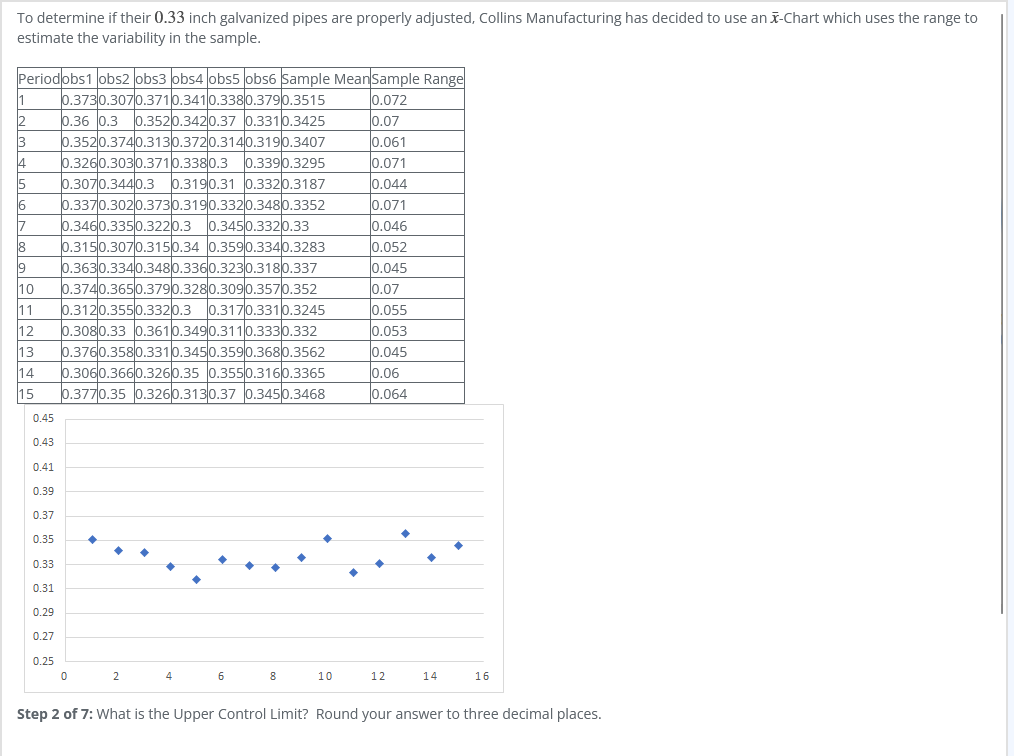
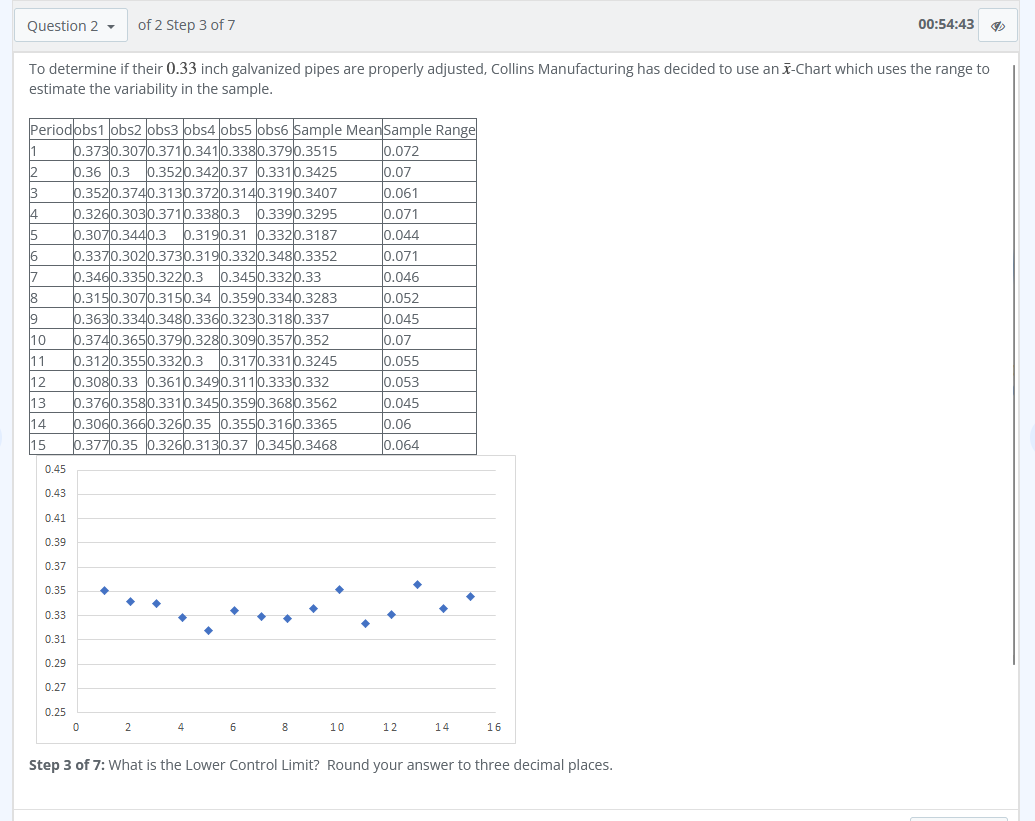
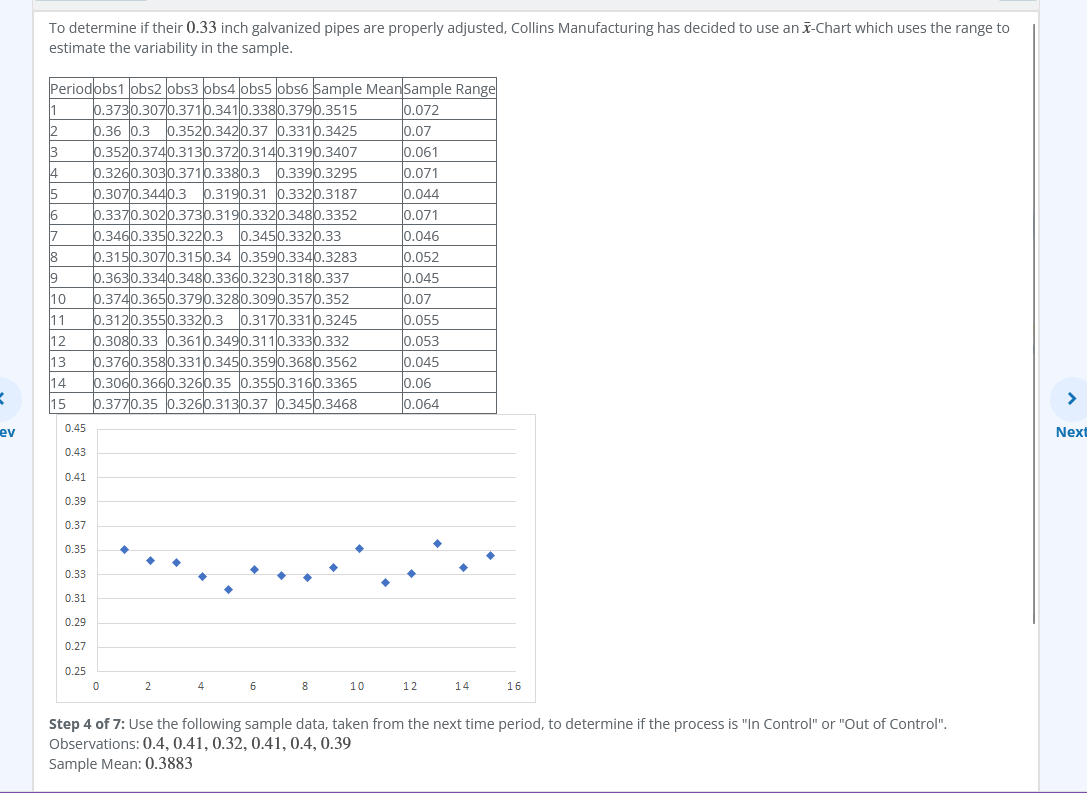
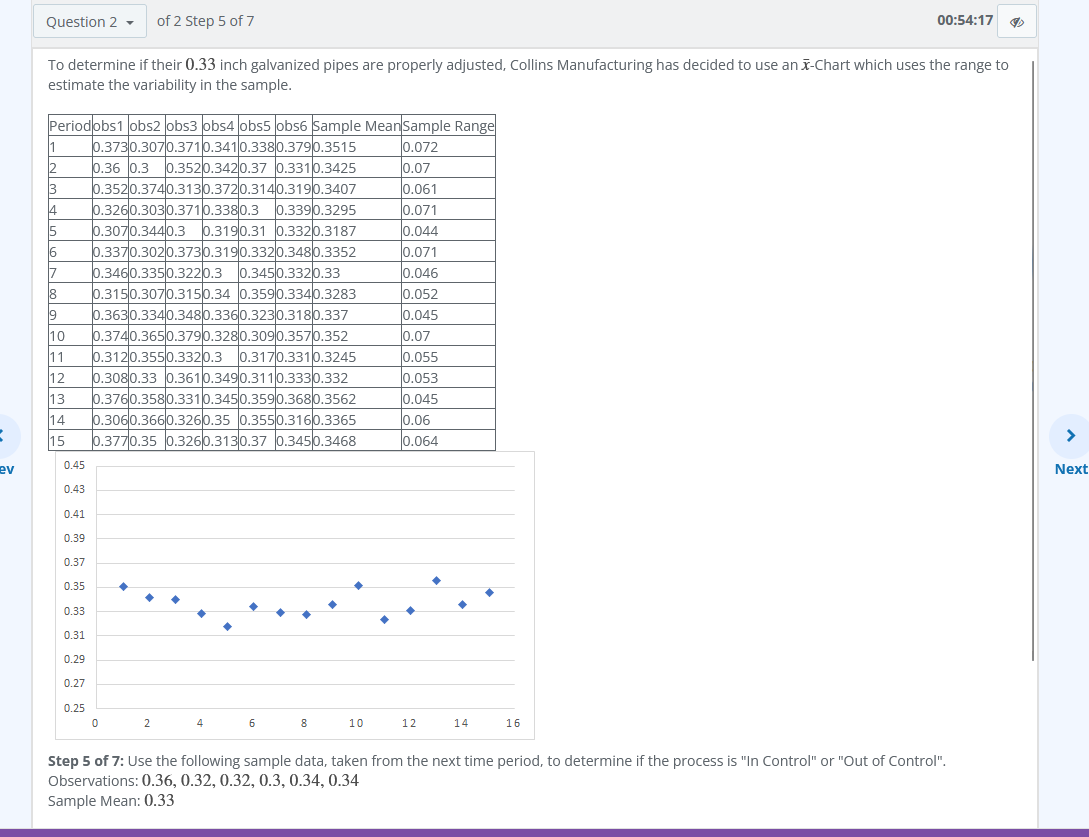
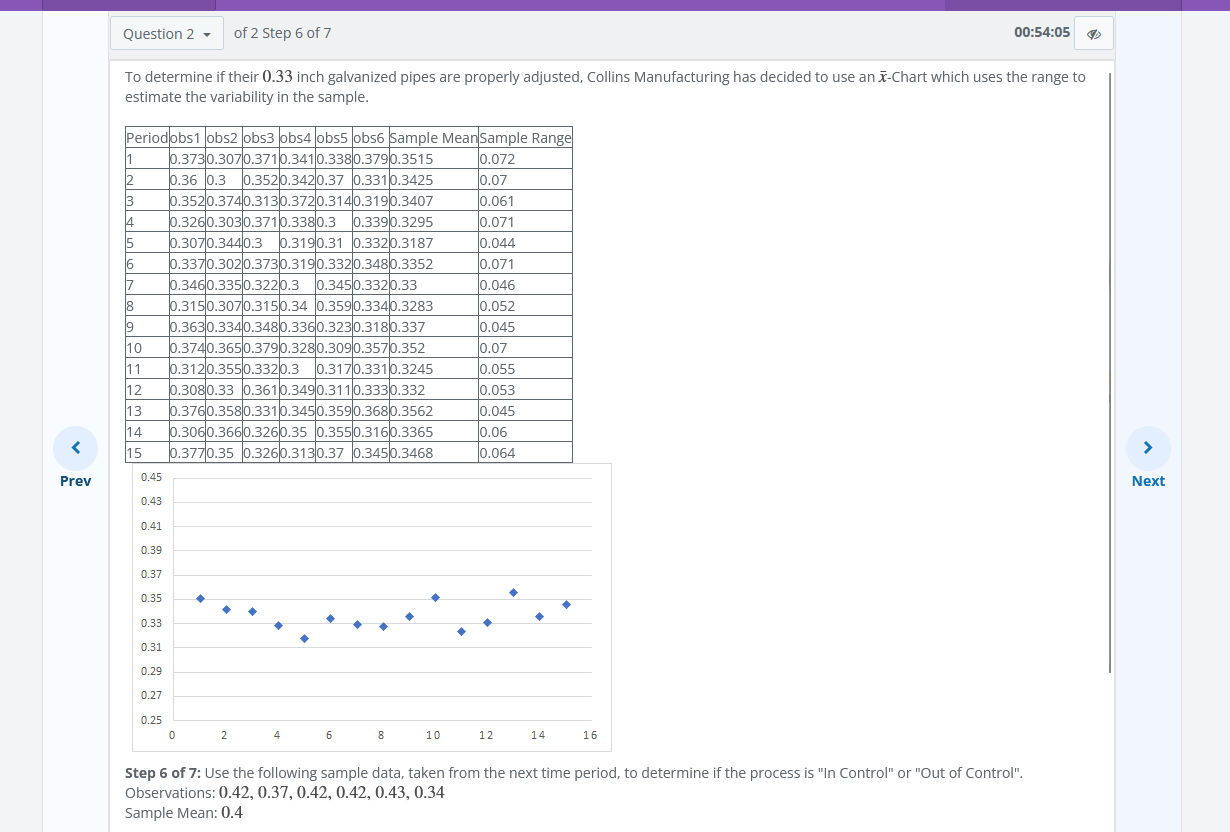
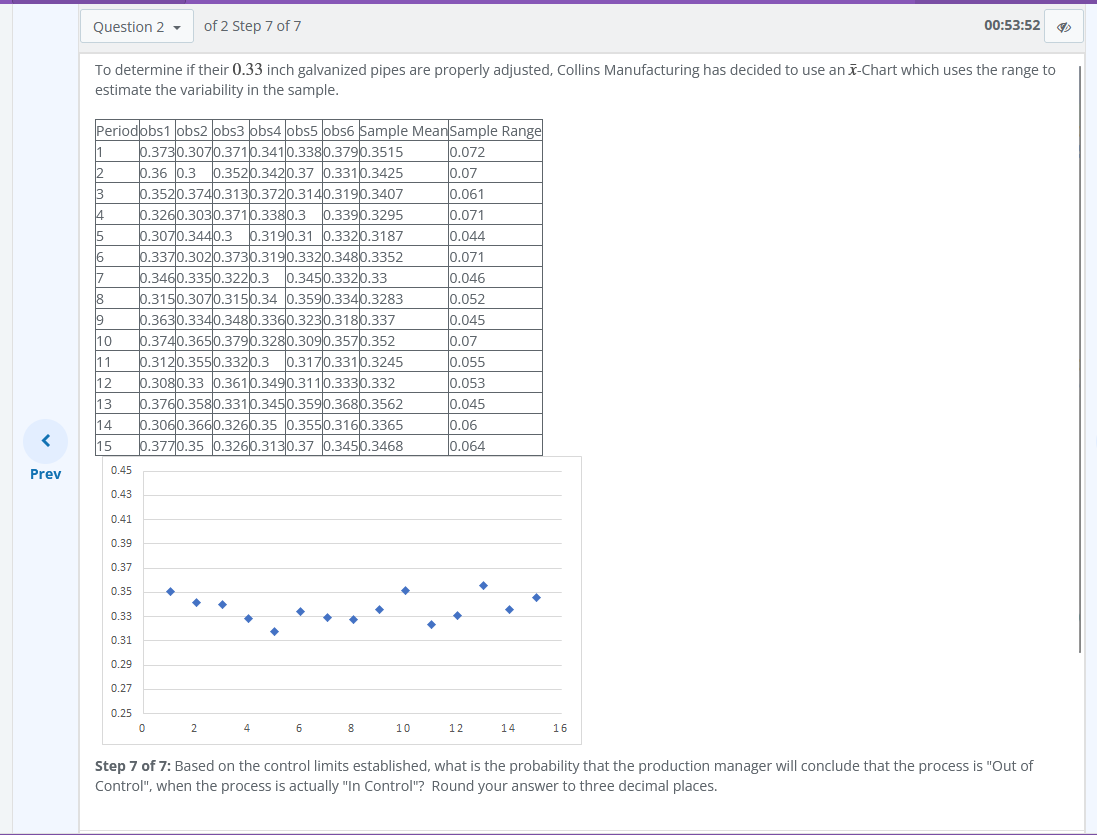
To determine if their 0.33 inch galvanized pipes are properly adjusted, Collins Manufacturing has decided to use an x-Chart which uses the range to estimate
Step by Step Solution
There are 3 Steps involved in it
Step: 1

Get Instant Access to Expert-Tailored Solutions
See step-by-step solutions with expert insights and AI powered tools for academic success
Step: 2

Step: 3
Ace Your Homework with AI
Get the answers you need in no time with our AI-driven, step-by-step assistance
Get Started
The Myth Of Measurement Inspection Audit Targets And The Public Sector
Authors: Nick Frost
1st Edition
1529732662, 978-1529732665