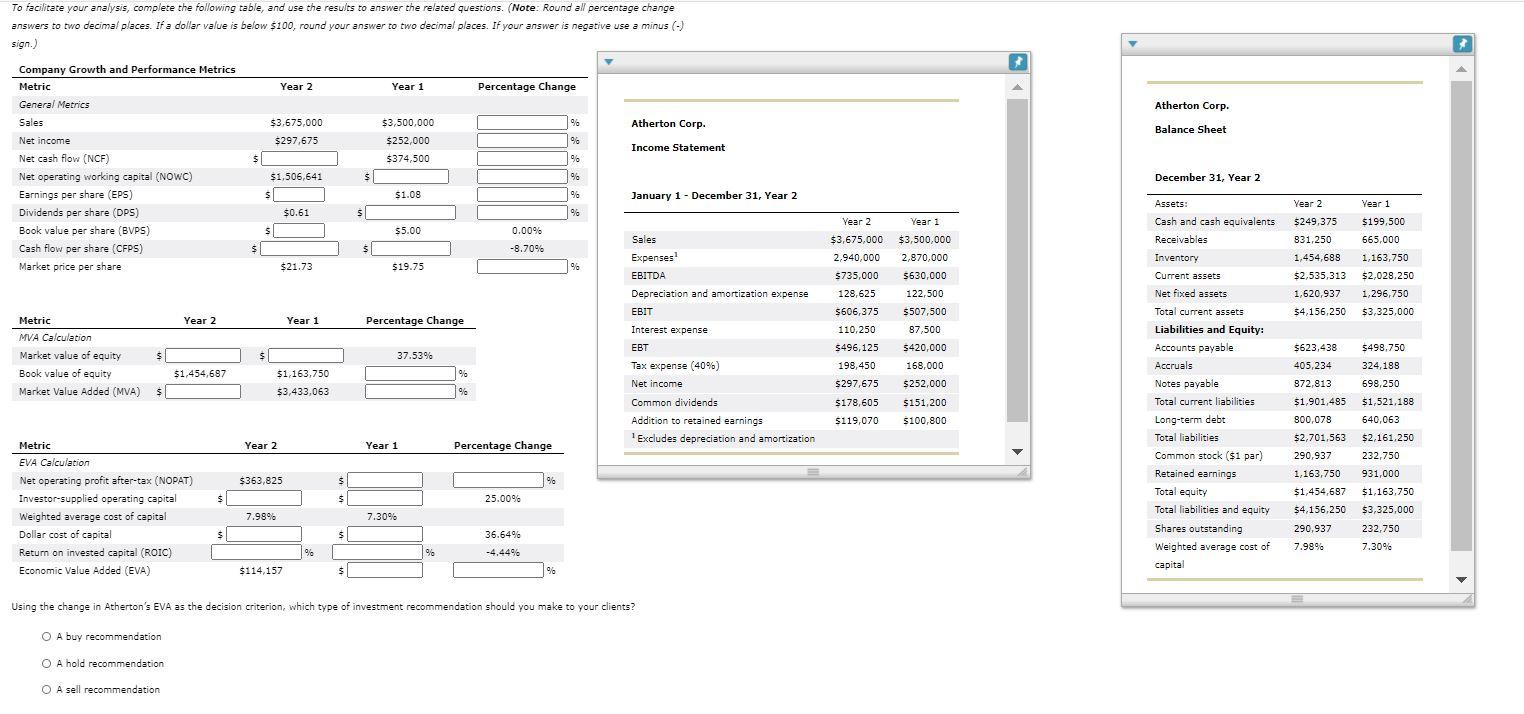
To facilitate your analysis, complete the following table, and use the results to answer the related questions. (Note: Round all percentage change answers to two decimal places. If a dollar value is below $100, round your answer to two decimal places. If your answer is negative use a minus (-) sign.) Year 2 Year 1 Percentage Change Atherton Corp. 96 Atherton Corp $3,675,000 $297,675 $3,500,000 $252,000 Balance Sheet % Income Statement S $374,500 % Company Growth and Performance Metrics Metric General Metrics Sales Net income Net cash flow (NCF) Net operating working capital (NOWC) Earnings per share (EPS) ) Dividends per share (DPS) Book value per share (BVPS) Cash flow per share (CFPS) Market price per share $1,506,641 S % December 31, Year 2 S 51.08 9 January 1 - December 31, Year 2 , 2 Year 1 $0.61 5 % Year 2 $249,375 831,250 $199,500 S s 55.00 0.00% -8.70% $ Sales Expenses EBITDA 665,000 1,163,750 $2,028.250 $21.73 519.75 1,454,683 $2,535,313 1,620,937 % 1,296,750 Depreciation and amortization expense EBIT Year 2 Year 1 $3,675,000 $3,500,000 2.940,000 2,870,000 5735,000 5630,000 128,625 122,500 5606,375 S507,500 110,250 87,500 5496,125 $420,000 198,450 168,000 5297,675 5252,000 $4,156,250 $3,325,000 Year 2 Year 1 Percentage Change Interest expense EBT Metric MVA Calculation Market value of equity Book value of equity Market Value Added (MVA) $ $ $ 37.53% $498,750 324,188 Tax expense (40%) $623,438 405,234 872,813 $1,454,687 % Assets: Cash and cash equivalents Receivables Inventory Current assets Net fixed assets Total current assets Liabilities and Equity: Accounts payable Accruals Notes payable Total current liabilities Long-term debt Total liabilities Common stock ($1 par) Retained earnings Total equity Total liabilities and equity Shares outstanding Weighted average cost of $1,163,750 $3,433,063 Net income S 96 $1,901,485 Common dividends Addition to retained earnings 1 Excludes depreciation and amortization 5178,605 $119,070 5151,200 5100,800 698,250 $1,521.188 640,063 800,078 $2,701,563 Year 2 Year 1 Percentage Change 290,937 1,163,750 $1,454,687 $2,161.250 232,750 931,000 $1,163.750 $3,325,000 $363,825 S % $ $ Metric EVA Calculation Net operating profit after-tax (NOPAT) Investor-supplied operating capital Weighted average cost of capital Dollar cost of capital Return on invested capital (ROIC) Economic Value Added (EVA) 25.00% 7.98% 7.30% 54,156.250 290,937 $ $ 36.64% -4.44% 232,750 7.30% 7.99% % 9% capital $114,157 $ 9% Using the change in Atherton's EVA as the decision criterion, which type of investment recommendation should you make to your clients? O A buy recommendation O A hold recommendation O A sell recommendation To facilitate your analysis, complete the following table, and use the results to answer the related questions. (Note: Round all percentage change answers to two decimal places. If a dollar value is below $100, round your answer to two decimal places. If your answer is negative use a minus (-) sign.) Year 2 Year 1 Percentage Change Atherton Corp. 96 Atherton Corp $3,675,000 $297,675 $3,500,000 $252,000 Balance Sheet % Income Statement S $374,500 % Company Growth and Performance Metrics Metric General Metrics Sales Net income Net cash flow (NCF) Net operating working capital (NOWC) Earnings per share (EPS) ) Dividends per share (DPS) Book value per share (BVPS) Cash flow per share (CFPS) Market price per share $1,506,641 S % December 31, Year 2 S 51.08 9 January 1 - December 31, Year 2 , 2 Year 1 $0.61 5 % Year 2 $249,375 831,250 $199,500 S s 55.00 0.00% -8.70% $ Sales Expenses EBITDA 665,000 1,163,750 $2,028.250 $21.73 519.75 1,454,683 $2,535,313 1,620,937 % 1,296,750 Depreciation and amortization expense EBIT Year 2 Year 1 $3,675,000 $3,500,000 2.940,000 2,870,000 5735,000 5630,000 128,625 122,500 5606,375 S507,500 110,250 87,500 5496,125 $420,000 198,450 168,000 5297,675 5252,000 $4,156,250 $3,325,000 Year 2 Year 1 Percentage Change Interest expense EBT Metric MVA Calculation Market value of equity Book value of equity Market Value Added (MVA) $ $ $ 37.53% $498,750 324,188 Tax expense (40%) $623,438 405,234 872,813 $1,454,687 % Assets: Cash and cash equivalents Receivables Inventory Current assets Net fixed assets Total current assets Liabilities and Equity: Accounts payable Accruals Notes payable Total current liabilities Long-term debt Total liabilities Common stock ($1 par) Retained earnings Total equity Total liabilities and equity Shares outstanding Weighted average cost of $1,163,750 $3,433,063 Net income S 96 $1,901,485 Common dividends Addition to retained earnings 1 Excludes depreciation and amortization 5178,605 $119,070 5151,200 5100,800 698,250 $1,521.188 640,063 800,078 $2,701,563 Year 2 Year 1 Percentage Change 290,937 1,163,750 $1,454,687 $2,161.250 232,750 931,000 $1,163.750 $3,325,000 $363,825 S % $ $ Metric EVA Calculation Net operating profit after-tax (NOPAT) Investor-supplied operating capital Weighted average cost of capital Dollar cost of capital Return on invested capital (ROIC) Economic Value Added (EVA) 25.00% 7.98% 7.30% 54,156.250 290,937 $ $ 36.64% -4.44% 232,750 7.30% 7.99% % 9% capital $114,157 $ 9% Using the change in Atherton's EVA as the decision criterion, which type of investment recommendation should you make to your clients? O A buy recommendation O A hold recommendation O A sell recommendation