Answered step by step
Verified Expert Solution
Link Copied!

Question

1 Approved Answer

To help consumers in purchasing a laptop computer, Consumer Reports calculates an overall test score for each computer tested based upon rating factors such as

To help consumers in purchasing a laptop computer,Consumer Reportscalculates an overall test score for each computer tested based upon rating factors such as ergonomics, portability, performance, display, and battery life. Higher overall scores indicate better test results. The following data show the average retail price and the overall score for ten13-inch models (Consumer Reportswebsite). Click on the datafile logo to reference the data.

(NEED ANSWER FOR D)

Please see attached for question
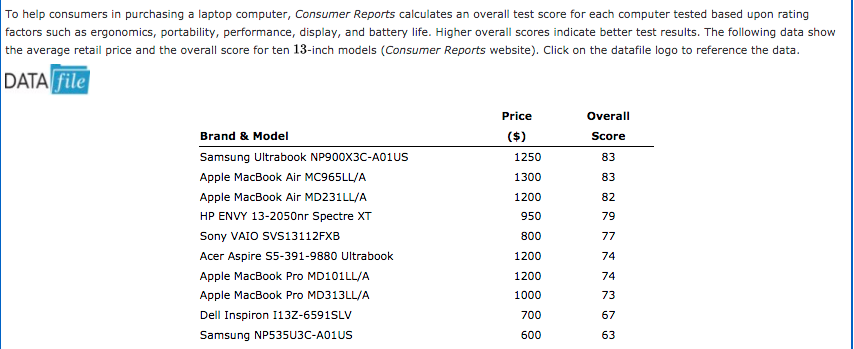
image text in transcribedimage text in transcribedimage text in transcribed
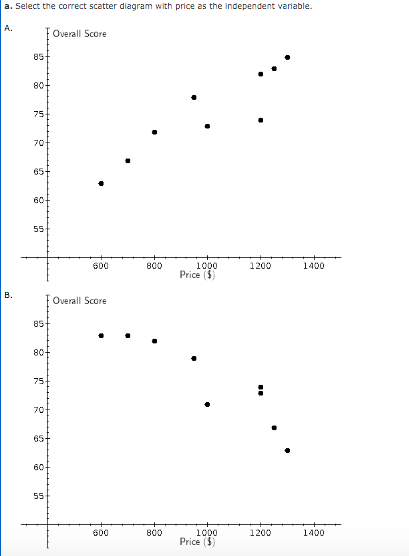
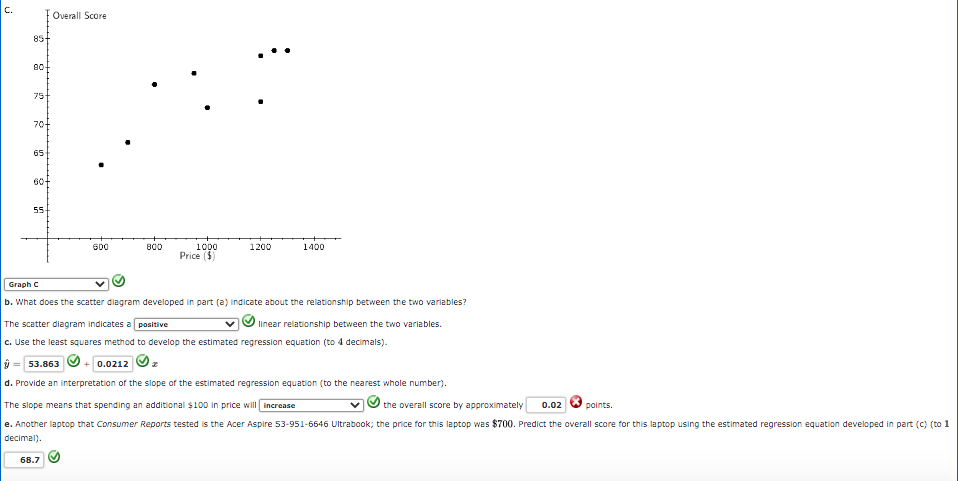
To help consumers in purchasing a laptop computer, Consumer Reports calculates an overall test score for each computer tested based upon rating factors such as ergonomics, portability, performance, display, and battery life. Higher overall scores indicate better test results. The following data show the average retail price and the overall score for ten 13-inch models (Consumer Reports website). Click on the datafile logo to reference the data. DATA file Price Overall Brand & Model ($) Score Samsung Ultrabook NP900X3C-A01US 1250 83 Apple MacBook Air MC965LL/A 1300 83 Apple MacBook Air MD231LL/A 1200 82 HP ENVY 13-2050nr Spectre XT 950 79 Sony VAIO SVS13112FXB 800 77 Acer Aspire $5-391-9880 Ultrabook 1200 74 Apple Macbook Pro MD101LL/A 1200 74 Apple Macbook Pro MD313LL/A 1000 73 Dell Inspiron I13Z-65915LV 700 67 Samsung NP535U3C-A01US 600 63a. Select the correct scatter diagram with price as the Independent variable. A. Overall Score 85+ 80+ 75+ 70- 80+ 55 600 800 1000 1200 1400 Price ($) B. Overall Score 85+ 80+ 75 70- 80+ 55 800 1000 1200 1400 Price ($)C. Overall Score 85+ 80+ 75+ 70+ 65 60+ 55+ 800 1000 1200 1400 Price ($) Graph C b. What does the scatter diagram developed in part (a) indicate about the relationship between the two variables? The scatter diagram indicates a positive linear relationship between the two variables. C. Use the least squares method to develop the estimated regression equation (to 4 decimals). 1 = 53.863 + 0.02120z d. Provide an interpretation of the slope of the estimated regression equation (to the nearest whole number). The slope means that spending an additional $100 in price will | increase the overall score by approximately 0.02 points. e. Another laptop that Consumer Reports tested is the Acer Aspire 53-951-6646 Ultrabook; the price for this laptop was $700. Predict the overall score for this laptop using the estimated regression equation developed in part (c) (to 1 decimal). 68.7

Step by Step Solution

There are 3 Steps involved in it

Step: 1

blur-text-image

Get Instant Access to Expert-Tailored Solutions

See step-by-step solutions with expert insights and AI powered tools for academic success

Step: 2

blur-text-image_2

Step: 3

blur-text-image_3

Ace Your Homework with AI

Get the answers you need in no time with our AI-driven, step-by-step assistance

Get Started

Recommended Textbook for

Finite Math And Applied Calculus

Authors: Stefan Waner, Steven Costenoble

6th Edition

1285415132, 9781285415130

More Books

Students also viewed these Mathematics questions