Answered step by step
Verified Expert Solution
Question
1 Approved Answer
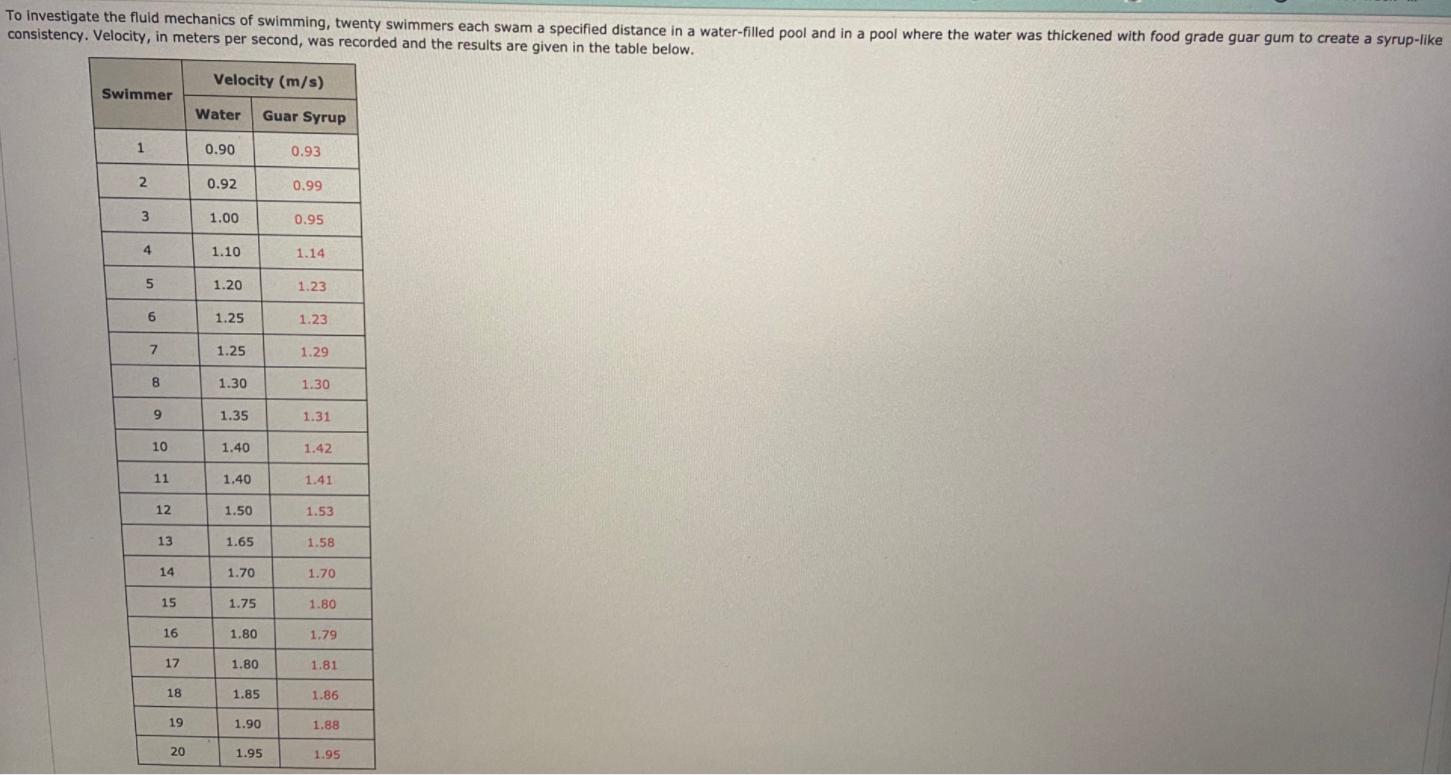
To investigate the fluid mechanics of swimming, twenty swimmers each swam a specified distance in a water-filled pool and in a pool where the


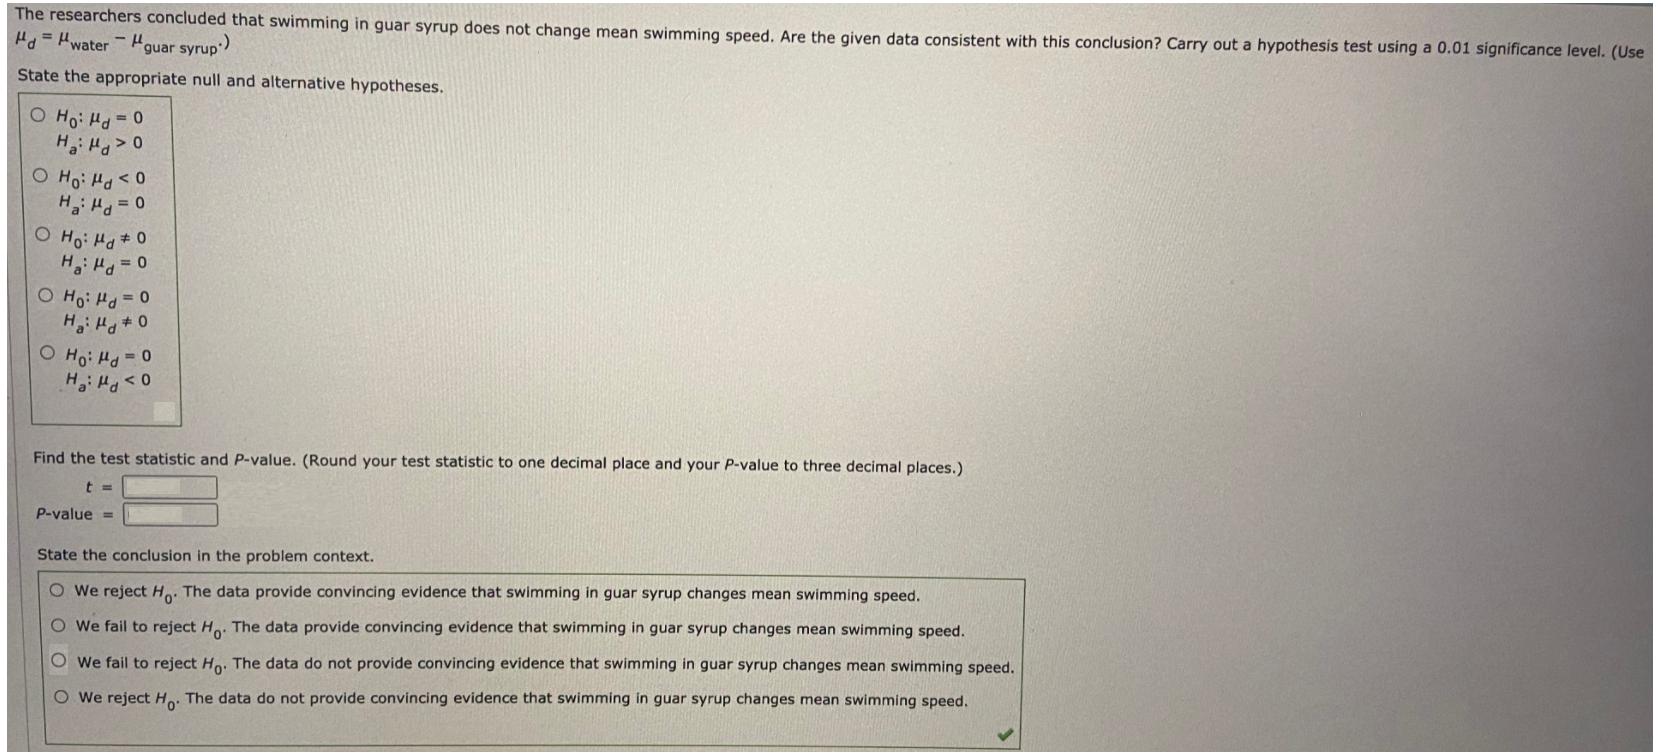
To investigate the fluid mechanics of swimming, twenty swimmers each swam a specified distance in a water-filled pool and in a pool where the water was thickened with food grade guar gum to create a syrup-like consistency. Velocity, in meters per second, was recorded and the results are given in the table below. Velocity (m/s) Swimmer Water Guar Syrup 0.90 0.93 0.92 0.99 1.00 0.95 4 1.10 1.14 1.20 1.23 6. 1.25 1.23 7. 1.25 1.29 8. 1.30 1.30 9. 1.35 1.31 10 1.40 1.42 1 1.40 1.41 12 1.50 1.53 13 1.65 1.58 14 1.70 1.70 15 1.75 1.80 16 1.80 1.79 17 1.80 1.81 18 1.85 1.86 19 1.90 1.88 20 1.95 1.95 The researchers concluded that swimming in guar syrup does not change mean swimming speed. Are the given data consistent with this conclusion? Carry out a hypothesis test using a 0.01 significance level. (Use Hd = Hwater Pguar syrup State the appropriate null and alternative hypotheses. H H> 0 0 = Prt :H O 0 > Prt :H O H H=D0 O Ho: Ha #0 Hi Hd = 0 O Ho: Hd = 0 0 = Prt :0H O o>Prt :H Find the test statistic and P-value. (Round your test statistic to one decimal place and your P-value to three decimal places.) P-value = State the conclusion in the problem context. O We reject H. The data provide convincing evidence that swimming in guar syrup changes mean swimming speed. O We fail to reject Ho. The data provide convincing evidence that swimming in guar syrup changes mean swimming speed. O we fail to reject Ho. The data do not provide convincing evidence that swimming in guar syrup changes mean swimming speed. O We reject Ho: The data do not provide convincing evidence that swimming in guar syrup changes mean swimming speed.
Step by Step Solution
★★★★★
3.44 Rating (154 Votes )
There are 3 Steps involved in it
Step: 1
Using Excel The given data is water guar syrup 09 092 ...
Get Instant Access to Expert-Tailored Solutions
See step-by-step solutions with expert insights and AI powered tools for academic success
Step: 2

Step: 3

Ace Your Homework with AI
Get the answers you need in no time with our AI-driven, step-by-step assistance
Get Started


