Question
To study the relationship between personal characteristics and salary, a data set containing information on salaries and personal characteristics of a sample of employees of
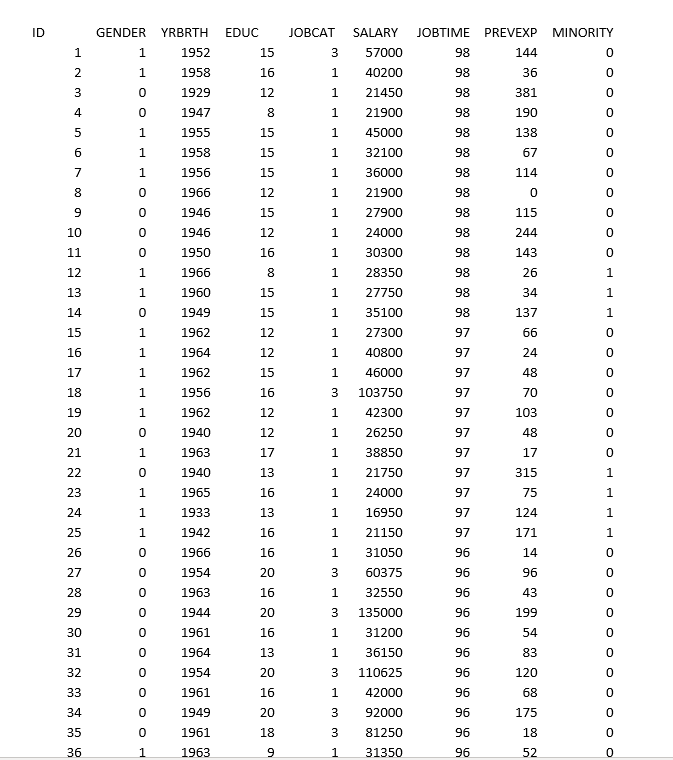
To study the relationship between personal characteristics and salary, a data set containing information on salaries and personal characteristics of a sample of employees of a large company has been collected. The file employee data.xls contains the data set. The variables in the data set are:
ID - Individual ID
GENDER - Gender of the individual, takes value 1 if the individual is male, 0 if the individual is female.
AGE - age of the individual
EDUC - Years of Education
JOBCAT - Job category. There are three types of jobs. The variable takes value 1 for clerical jobs, 2 for custodial jobs, and 3 for managerial jobs.
SALARY - Current salary
JOBTIME - Number of months with the company.
PREVEXP - Previous work experience measured in months.
MINORITY - Minority status. Takes value 1 if the individual belongs to a minority group, 0 otherwise.
Instructions:
-Complete the analysis in STATA
-Answer the questions in the space provided.
-Save your STATA output as a PDF file
-Submit the answer sheet and the STATA output using the links provided.
1.Descriptive statistics (2 points)
a.(1 point) What is the number of observations and the number of variables in the data set? WRITE DOWN THESE STATISTICS HERE
b.(1 point) Compute the sample mean, the sample median, the sample standard deviation for current salary (SALARY). WRITE DOWN THESE STATISTICS HERE.
2.Generate new variables (2 points)
a.(1 point) Construct a new variable ED16 that takes value 1 if the individual has 16 years of education or more (EDUC is greater than or equal to 16) and 0 if the individual has fewer than 16 years of education (EDUC is smaller than 16)
b.(1 point) Construct a new variable HIWAGE that takes value 1 if the individual's salary (SALARY) is greater than the average salary for the entire sample.
3.Events and their probabilities (5 points)
a.(1 point) How many individuals have 16 years of education or more? WRITE DOWN THE STATISTICS HERE.
b.(1 point) What is the probability that a randomly selected individual has 16 years of education or more? WRITE DOWN THE STATISTICS HERE.
c.(1 point) What is the proportion of women in the sample? WRITE DOWN THE STATISTICS HERE.
d.(1 point) Conditional on 16 years of education or more, what is the probability that an individual has higher than average salary? (HINT: Use the variable HIWAGE created at point 2) WRITE DOWN THE STATISTICS HERE.
e.(1 point) Are having 16 years of education ore more and having higher than average salary independent events? EXPLAIN. SHOW ALL YOUR CALCULATIONS (NO CREDIT WILL BE GIVEN FOR YES/NO ANSWERS)
4.Comparison of means (5 points)
a.(1 point) Compute the average salary (SALARY) for men and the average salary for women. WRITE DOWN THE RESULT HERE
b.(1 point) Compute the average number of years of education (EDUC) for men and the average number of years of education for women. WRITE DOWN THE RESULT HERE
c.(1 point) Compute the average number of months with the company (JOBTIME) for men and the average number of months with the company for women. WRITE DOWN THE RESULT HERE
d.(1 point) Compute the average number of months of previous experience (PREVEXP) for men and the average number of months of previous experience (PREVEXP) for women. WRITE DOWN THE RESULT HERE
a.(1 point) Summarize your findings at points a-d. Answer the following questions: (1) Are there any gender wage differentials? (2) Could the gender wage differentials be explained, in part, by differences in other personal characteristics? EXPLAIN YOUR ANSWER. (NO CREDIT WILL BE GIVEN FOR YES/NO ANSWERS)
5.Correlation Coefficients (2 points)
a.(1 point) Compute the correlation coefficient for number of years of education (EDUC) and salary (SALARY). WRITE DOWN THE STATISTICS HERE.
b.(1 point) What does the correlation coefficient suggests? (COMMENT ON THE SIGN & STRENGTH, AND EXPLAIN THE IMPLIED RELATIONSHIP BETWEEN THE VARIABLES).
6.Graphical Analysis (4 points)
a.(1 point) Construct a histogram for salary (SALARY). COPY THE GRAPH AND INSERT IT HERE
b.(1 point) Construct the kernel density estimate for salary (SALARY). COPY THE GRAPH AND INSERT IT HERE
c.(1 point) Construct a scatter plot graph of the number of years of education (EDUC) (X-axis) and salary (SALARY) (Y-axis). COPY THE GRAPH AND INSERT IT HERE
d.(1 point) What does the scatter plot graph suggest about the relationship between education and salary? EXPLAIN
Please write the STATA equations next to each question. THank you

Step by Step Solution
There are 3 Steps involved in it
Step: 1

Get Instant Access to Expert-Tailored Solutions
See step-by-step solutions with expert insights and AI powered tools for academic success
Step: 2

Step: 3

Ace Your Homework with AI
Get the answers you need in no time with our AI-driven, step-by-step assistance
Get Started


