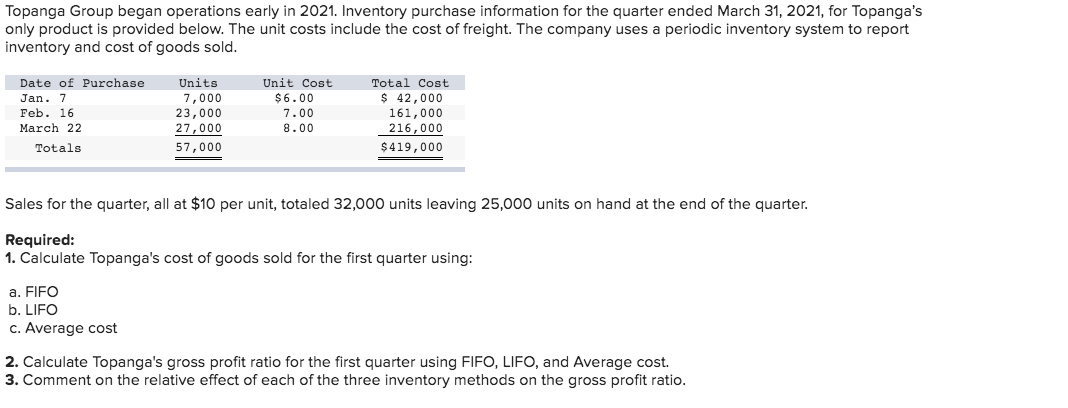
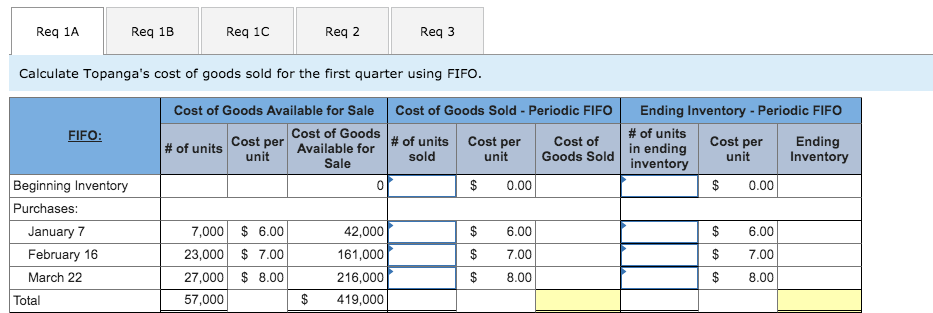
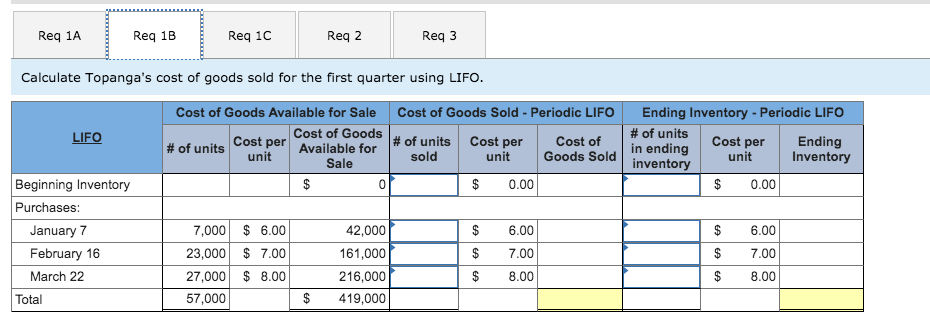
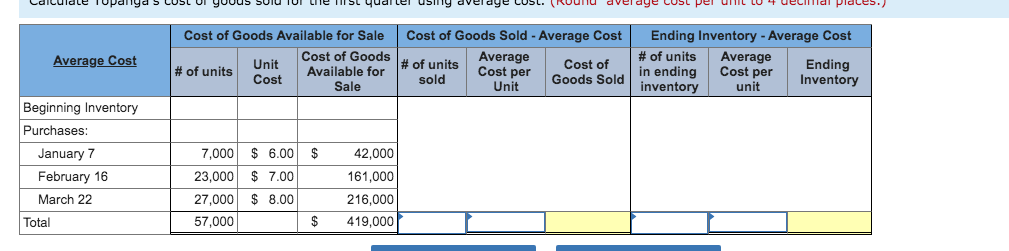
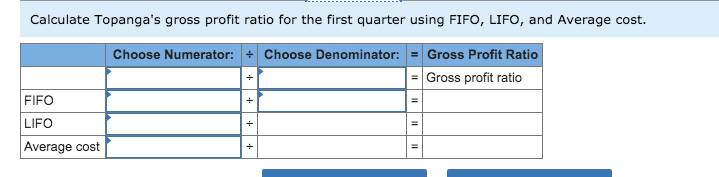

Topanga Group began operations early in 2021. Inventory purchase information for the quarter ended March 31, 2021, for Topanga's only product is provided below. The unit costs include the cost of freight. The company uses a periodic inventory system to report inventory and cost of goods sold. Date of Purchase Jan. 7 Feb. 16 March 22 Totals Units 7,000 23,000 27,000 57,000 Unit Cost $6.00 7.00 8.00 Total Cost $ 42,000 161,000 216,000 $ 419,000 Sales for the quarter, all at $10 per unit, totaled 32,000 units leaving 25,000 units on hand at the end of the quarter. Required: 1. Calculate Topanga's cost of goods sold for the first quarter using: a. FIFO b. LIFO c. Average cost 2. Calculate Topanga's gross profit ratio for the first quarter using FIFO, LIFO, and Average cost. 3. Comment on the relative effect of each of the three inventory methods on the gross profit ratio. Req 1A Req 1B Req 1C Req 2 Req3 Calculate Topanga's cost of goods sold for the first quarter using FIFO. FIFO: Cost of Goods Available for Sale Cost of Goods Sold - Periodic FIFO Cost of Goods # of units Cost per # of units Cost per Available for Cost of unit Sale sold unit Goods Sold 0 $ 0.00 Ending Inventory - Periodic FIFO # of units Cost per in ending Ending unit inventory Inventory $ 0.00 $ $ 6.00 GA 6.00 Beginning Inventory Purchases: January 7 February 16 March 22 Total $ 7.00 $ 7.00 7,000 $ 6.00 23,000 $ 7.00 27,000 $ 8.00 57,000 42,000 161,000 216,000 419,000 $ 8.00 $ 8.00 $ Req 1A Req 1B Req 1C Req 2 Req3 Calculate Topanga's cost of goods sold for the first quarter using LIFO. LIFO Cost of Goods Available for Sale Cost of Goods Sold - Periodic LIFO Cost of Goods # of units Cost per Available for # of units Cost per Cost of unit sold unit Sale Goods Sold $ 0 $ 0.00 Ending Inventory - Periodic LIFO # of units in ending Cost per Ending unit inventory Inventory $ 0.00 $ $ 6.00 $ Beginning Inventory Purchases: January 7 February 16 March 22 Total $ 7,000 $ 6.00 23,000 $ 7.00 27,000 $ 8.00 57,000 42,000 161,000 216,000 419,000 $ $ 7.00 8.00 6.00 7.00 8.00 $ $ COSL. (rou average cOS per un to tuemar places) Average Cost Cost of Goods Available for Sale Cost of Goods Unit # of units Available for Cost Sale Cost of Goods Sold - Average Cost Average # of units Cost per Cost of sold Unit Goods Sold Ending Inventory - Average Cost # of units Average Cost per Ending in ending inventory unit Inventory Beginning Inventory Purchases: January 7 February 16 March 22 Total 7,000 $ 6.00 $ 23,000 $ 7.00 27,000 $ 8.00 57,000 $ 42,000 161,000 216,000 419,000 Calculate Topanga's gross profit ratio for the first quarter using FIFO, LIFO, and Average cost. Choose Numerator: - Choose Denominator: Gross Profit Ratio = Gross profit ratio = + FIFO LIFO Average cost + Comment on the relative effect of each of the three inventory methods on the gross profit ratio. In situations when costs are rising, LIFO results in a cost of goods sold and therefore, a gross profit ratio than FIFO