Question
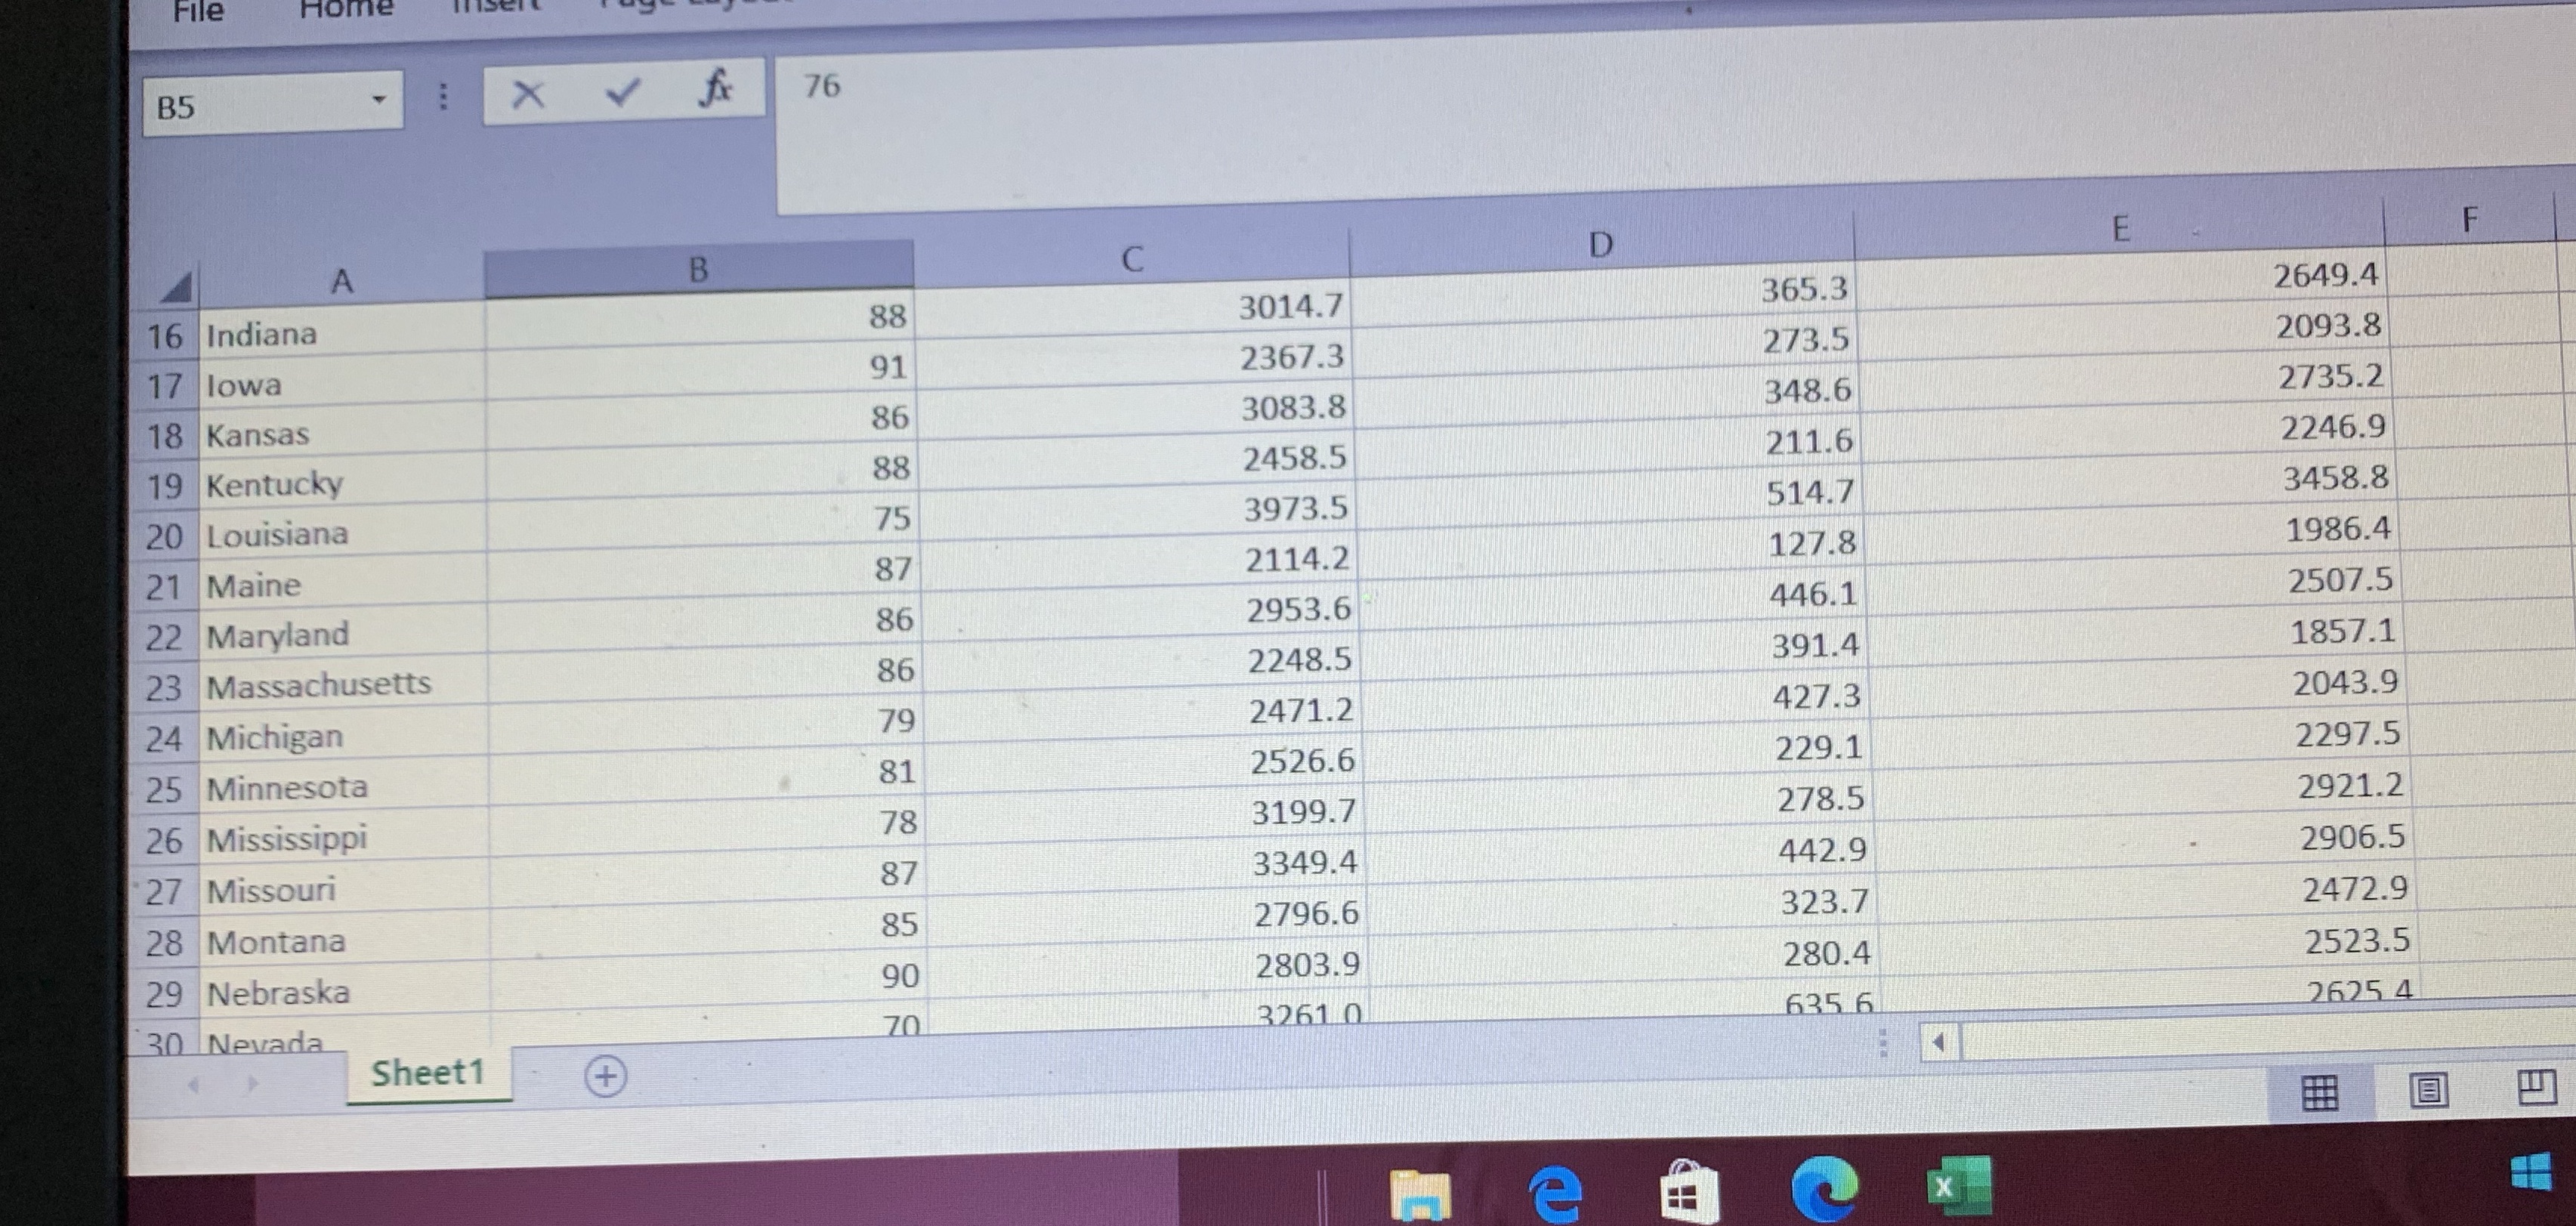
Topic: Is there a Correlation?Main Post: Consider the dataset that you analyzed in Unit 1. If your dataset did not have two quantitative variables or
Topic: Is there a Correlation?Main Post: Consider the dataset that you analyzed in Unit 1. If your dataset did not have two quantitative variables or if you would prefer using a different dataset, visit the dataset link to select a new data set of interest to you. See Example and DB starter video in Unit 8 LiveBinder.Determine the following information on your selected data set. Be sure to answer all questions using complete sentences. 1. State the dataset and the two quantitative variables of interest. Do you think there might be a correlation between the two variables (before you analyze the data)? Why or why not.2. Create a scatterplot with a simple linear regression. Attach the scatterplot to your post.3. Run the regression analysis in Excel Data Analysis. Share the output.4. What is the coefficient of determination r2? Summarize the results by stating whether this is a strong or weak relationship. State whether it is a positive or negative relationship. Is this result what you expected?5. Use the regression analysis output to determine the linear regression (best fit prediction line) equation.

Step by Step Solution
There are 3 Steps involved in it
Step: 1

Get Instant Access to Expert-Tailored Solutions
See step-by-step solutions with expert insights and AI powered tools for academic success
Step: 2

Step: 3

Ace Your Homework with AI
Get the answers you need in no time with our AI-driven, step-by-step assistance
Get Started


