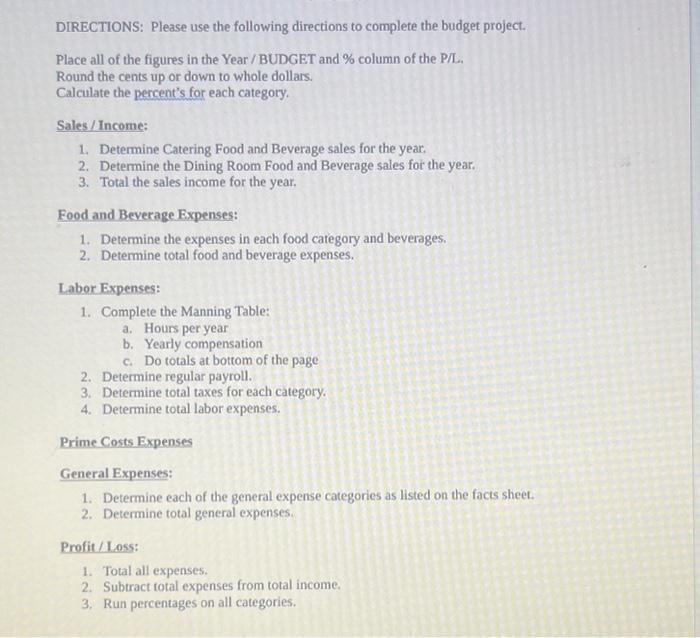
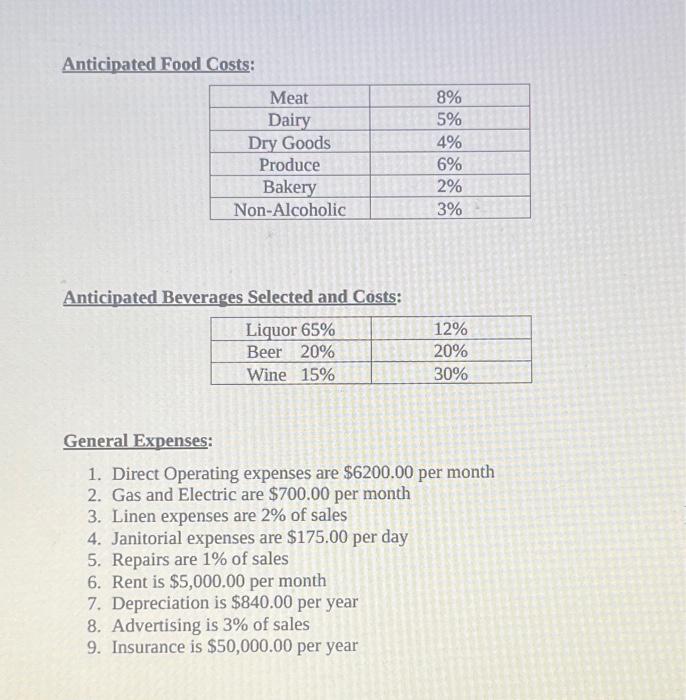
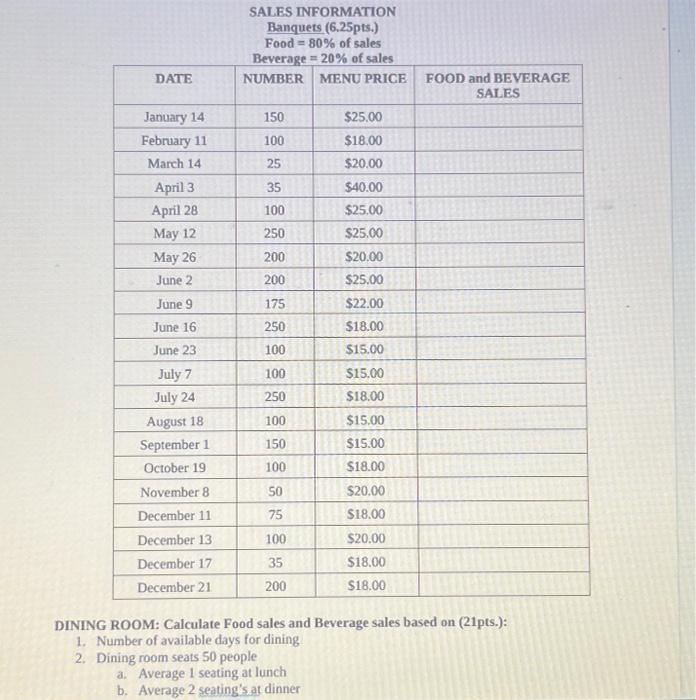
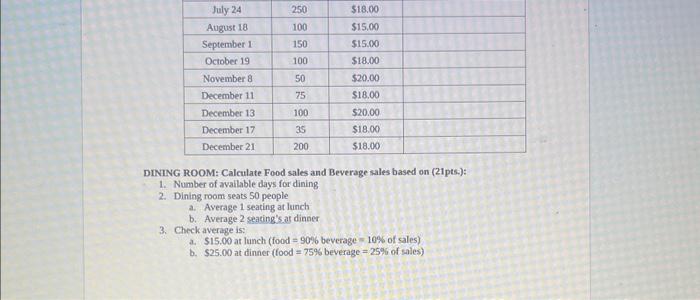
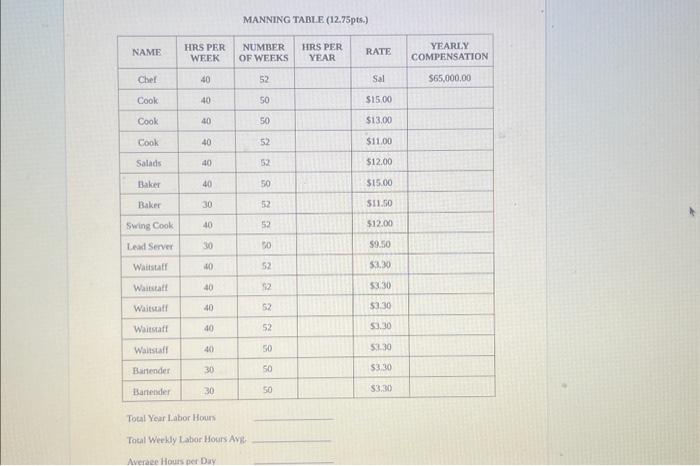
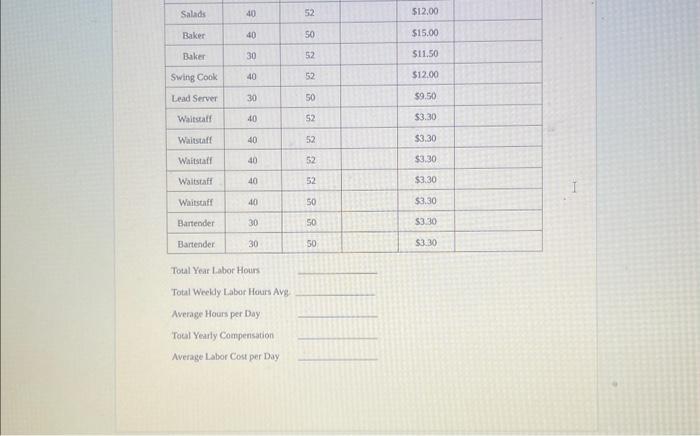
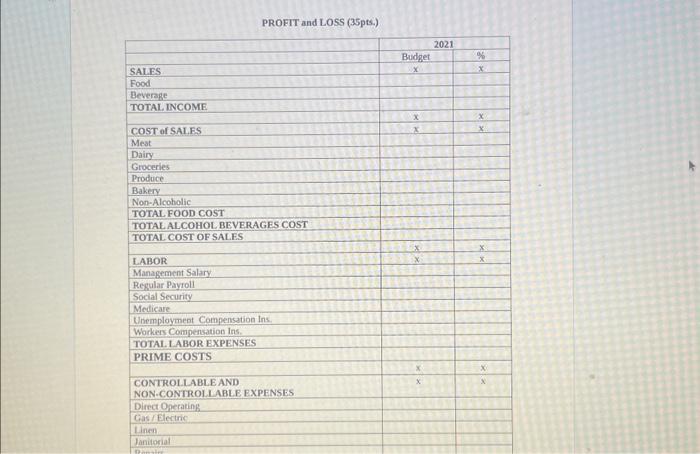
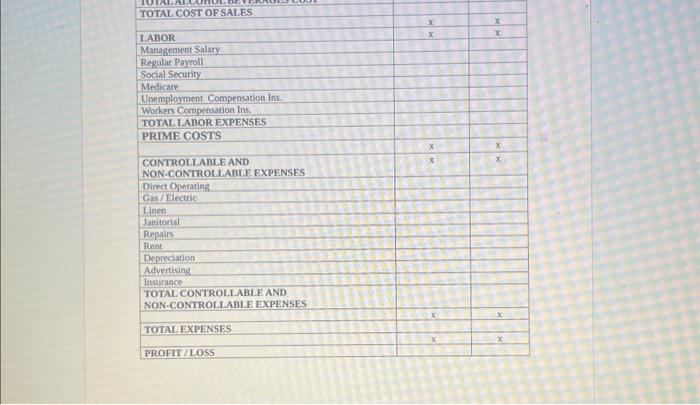
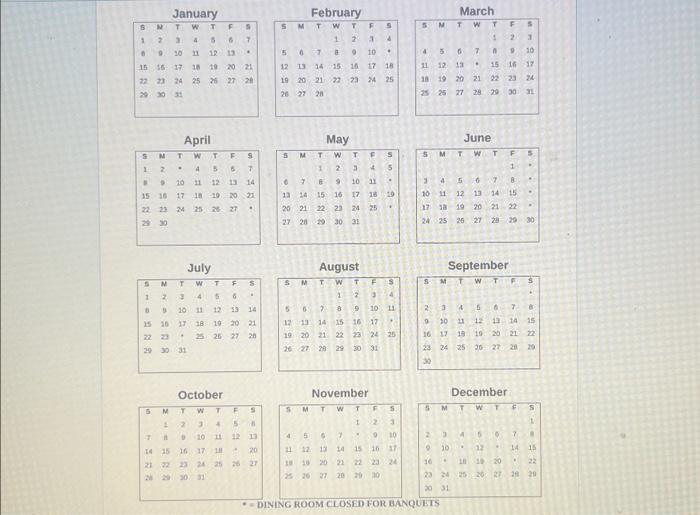
Toul Year Labor Hours Total Weeldy Labor Hours Avg Average Hours per Day Toal Yearly Compensation Average Labor Cost per Day DINING ROOM: Calculate Food sales and Beverage sales based on (21pts.): 1. Number of avaliable days for dining 2. Dining room seats 50 people a. Average 1 seating at lunch b. Average 2 seating's at dinner 3. Check average is: a. $15.00 at lunch ( food =90% beverage =10% of sales) b. $25.00 at dinner ( food =75% beverage =25% of sales ) Anticipated Food Costs: Anticipated Beverages Selected and Costs: General Expenses: 1. Direct Operating expenses are $6200.00 per month 2. Gas and Electric are $700.00 per month 3. Linen expenses are 2% of sales 4. Janitorial expenses are $175.00 per day 5. Repairs are 1% of sales 6. Rent is $5,000.00 per month 7. Depreciation is $840.00 per year 8. Advertising is 3% of sales 9. Insurance is $50,000.00 per year MANNING TABLE (12.75pts.) Tocal Year Labor Houn Tocal Weekly Labor Hours Avg Averaee Hours per Day DINING ROOM: Calculate Food sales and Beverage sales based on (21pts.): 1. Number of available days for dining 2. Dining room seats 50 people a. Average 1 seating at lunch b. Average 2 seating's at dinner DIRECTIONS: Please use the following directions to complete the budget project. Place all of the figures in the Year / BUDGET and \% column of the P/L. Round the cents up or down to whole dollars. Calculate the percent's for each category. Sales / Income: 1. Determine Catering Food and Beverage sales for the year, 2. Determine the Dining Room Food and Beverage sales for the year. 3. Total the sales income for the year, Food and Beverage Expenses: 1. Determine the expenses in each food category and beverages. 2. Determine total food and beverage expenses. Labor Expenses: 1. Complete the Manning Table: a. Hours per year b. Yearly compensation c. Do totals at bottom of the page 2. Determine regular payroll. 3. Determine total taxes for each category. 4. Determine total labor expenses. Prime Costs Expenses General Expenses: 1. Determine each of the general expense categories as listed on the facts sheet. 2. Determine total general expenses. Profit/Loss: 1. Total all expenses. 2. Subtract total expenses from total income. 3. Run percentages on all categories. April July February May August November \begin{tabular}{|c|c|c|c|c|c|c|} \hline 5 & M & T & w & T & F & 5 \\ \hline & & & & 1 & 2 & 3 \\ \hline 4 & 5 & 6 & 7 & A & 9 & 10 \\ \hline 11 & 12 & 13 & 24 & 15 & 16 & 37 \\ \hline 38 & 20 & 20 & n & 22 & 23 & 24 \\ \hline 25 & 26 & 27 & 20 & 24 & 70 & \\ \hline \end{tabular} March June September December \begin{tabular}{|c|c|c|c|c|c|c|} \hline 5 & M & T & w & 7 & 5 & 5 \\ \hline 2 & 3 & 4 & 5 & 6 & 7 & \\ \hline 2 & 10 &. & 12 & * & 14 & 1s \\ \hline 16 & , & if & is & 20 & . & 22 \\ \hline 23 & 34 & 25 & 26 & 27 & 211 & 28 \\ \hline 20 & 31 & & & & & \\ \hline \end{tabular} - DINING ROOM CLOSED FOR BANQUETS
