

Answered step by step
Verified Expert Solution
Question
1 Approved Answer
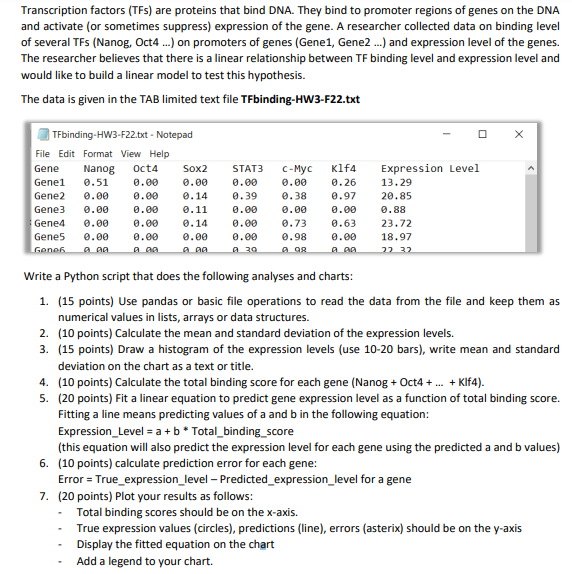
Transcription factors (TFs) are proteins that bind DNA. They bind to promoter regions of genes on the DNA and activate (or sometimes suppress) expression of
Step by Step Solution
There are 3 Steps involved in it
Step: 1

Get Instant Access to Expert-Tailored Solutions
See step-by-step solutions with expert insights and AI powered tools for academic success
Step: 2

Step: 3
Ace Your Homework with AI
Get the answers you need in no time with our AI-driven, step-by-step assistance
Get Started
Administering Relational Databases On Microsoft Azure A Detail Paradigm To Support Sql On Azure Cloud And Dp 300 Study Guide
Authors: Prashanth Jayaram ,Ahmad Yaseen ,Rajendra Gupta
1st Edition
979-8706128029