Answered step by step
Verified Expert Solution
Link Copied!

Question

1 Approved Answer

- Trenton sold 6,800 sets in 2019, and its actual operating income was as follows: - Prepare a flexible budget performance report through operating income

- Trenton sold 6,800 sets in 2019, and its actual operating income was as follows:image text in transcribed

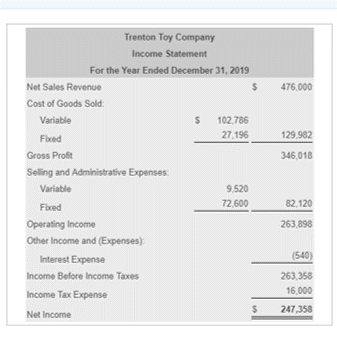
- Prepare a flexible budget performance report through operating income for 2019. Show product costs separately from selling and administrative costs. To simplify the calculations due to sets in beginning inventory having a different cost than those produced and sold in 2019, assume the following product costs:image text in transcribed

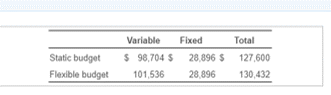
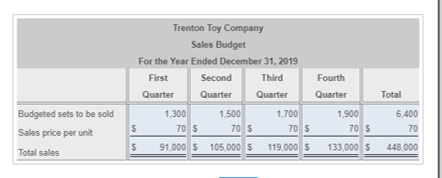
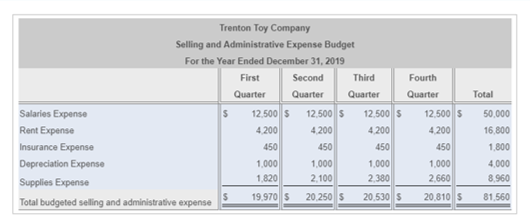
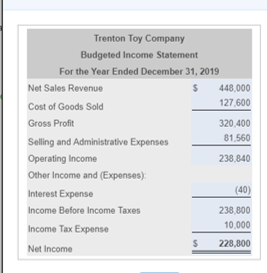
- here's the sales budget, selling and administrative expense budget, and the income statement I had to prepare:

image text in transcribedimage text in transcribedimage text in transcribed

What I need to fill out: image text in transcribed

Trenton Toy Company Income Statement For the Year Ended December 31, 2019 Net Sales Revenue S 476,000 Cost of Goods Sold Variable S 102,786 27 196 129 982 346,018 Ftced Gross Proft Seling and Administrative Expenses 9,520 72.600 Variable Flced 82.120 Operating Income Other Income and (Expenses) 263.898 (540) Interest Expense Income Before lIncome Taxes Income Tax Expense Net Income 263.358 16,000 247,358 Variable Fixed Total Static budget 98,704 28,896 S 127,600 Flexible budget 101,53628,896130,432 Trenton Toy Company Sales Budget For the Year Ended December 31, 2019 Second Third Quarter Quarter Quarter Quarter First Total 1.30 1.50 1.700 Budgeted sets to be sold Sales price per unit Total sales 6,400 70 S 91,000 $ 105,000 $ 119.000 S 133,000$448,000 900 70 S 70 S 70 S 70 S Trenton Toy Company Selling and Administrative Expense Budget For the Year Ended December 31, 2019 SecondThird QuarterQuarter Quarter Quarter First Fourth Total Salaries Expense Rent Expense Insurance Expense Depreciation Expense Supplies Expense Total budgeted selling and administrative expense $ 12.5001$ 12.500|| $ 42001 4.2001 42001 4.2001 16,000 12,5001$ 12.500|$ 50,000 800 4,000 8,960 $ 19,970 $20,250 S 20,530 $20,810 S 81,560 450 1,0001 1,0001 1,0001 2.100 450 450 450 1,000 2660 820 2.380 Trenton Toy Company Budgeted Income Statement For the Year Ended December 31, 2019 Net Sales Revenue Cost of Goods Sold Gross Profit Selling and Administrative Expenses Operating Income Other Income and (Expenses): nterest Expense Income Before Income Taxes Income Tax Expense Net Income $448.000 127,600 20.400 81,560 238,840 (40) 38,800 0,000 $ 228,800 Trenton Toy Company Flexible Budget Performance Report For the Year Ended December 31, 2019 Budget Amounts Actual Per Unit Results Flexible Budget Variance Sales Flexible VolumeStatic BudgetVariance Budget Units Net Sales RevenueL Variable Costs Product Costs Selling and Admin. Costs Contribution Margin Fixed Costs Product Costs Selling and Admin. Costs Operating Income

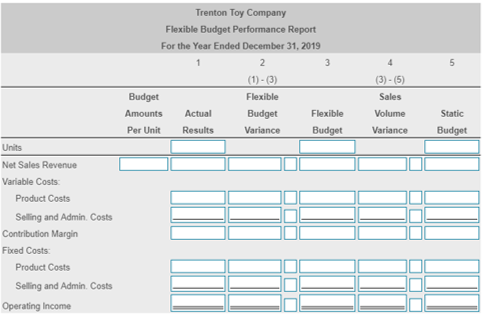
Step by Step Solution

There are 3 Steps involved in it

Step: 1

blur-text-image

Get Instant Access to Expert-Tailored Solutions

See step-by-step solutions with expert insights and AI powered tools for academic success

Step: 2

blur-text-image

Step: 3

blur-text-image

Ace Your Homework with AI

Get the answers you need in no time with our AI-driven, step-by-step assistance

Get Started

Recommended Textbook for

More Books

Students also viewed these Accounting questions