Two questions attached will rate if helpful
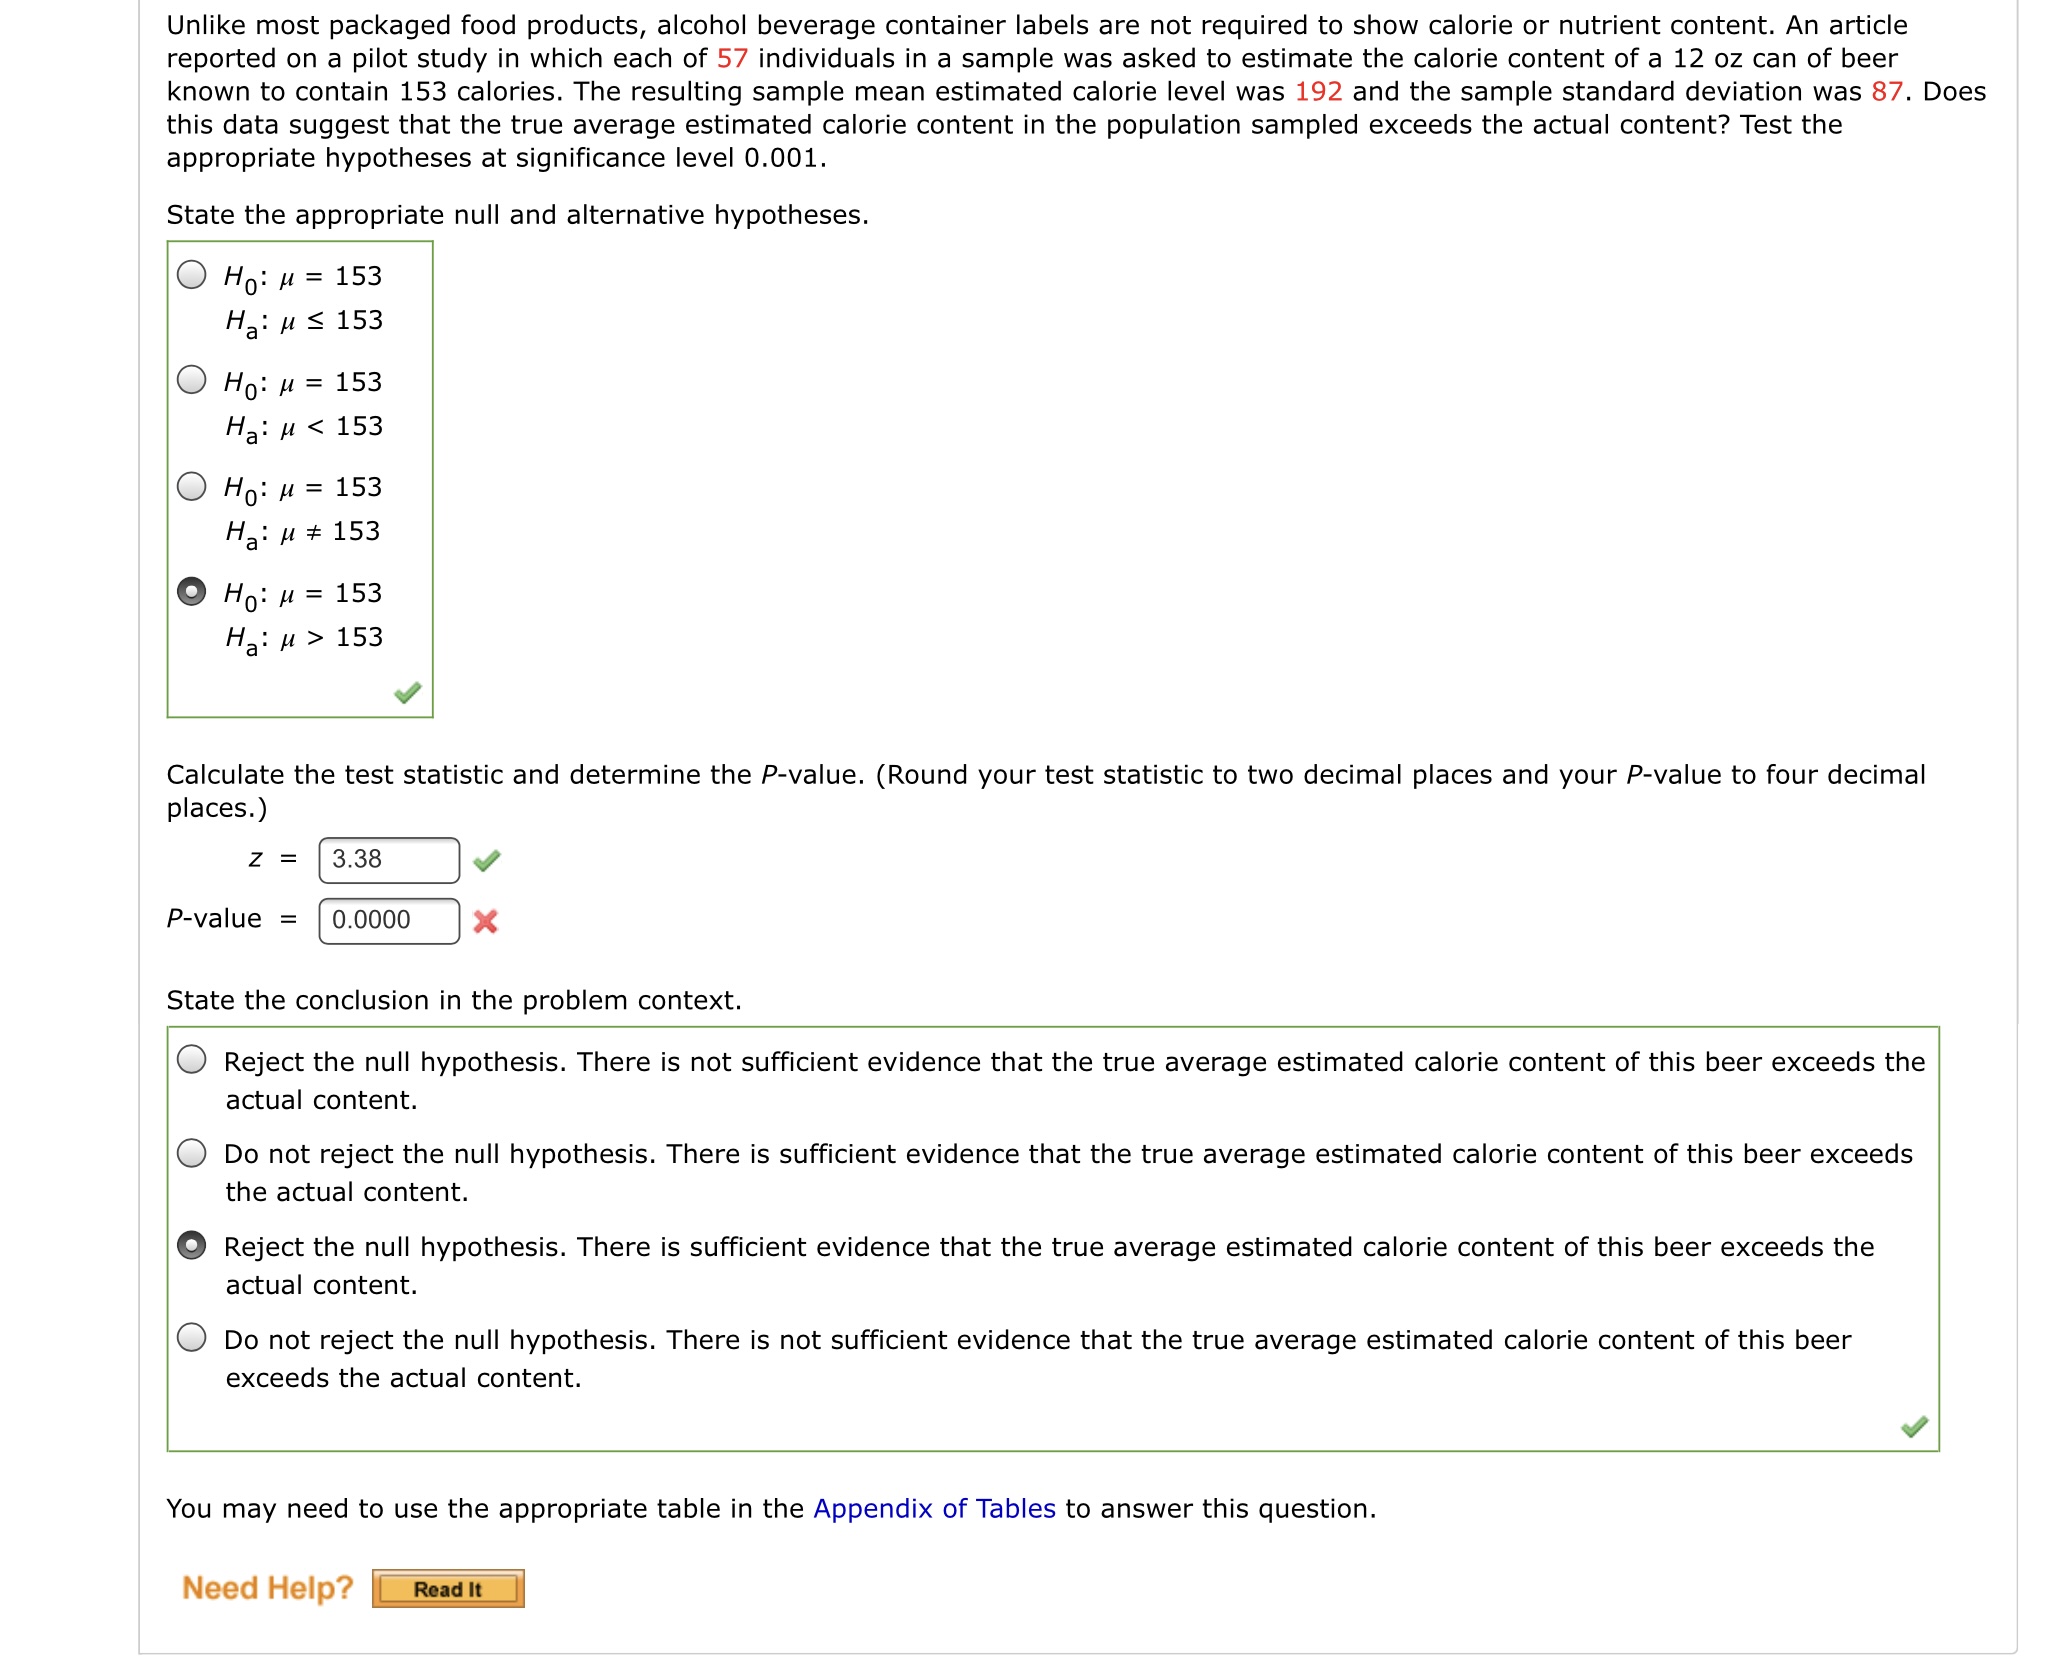
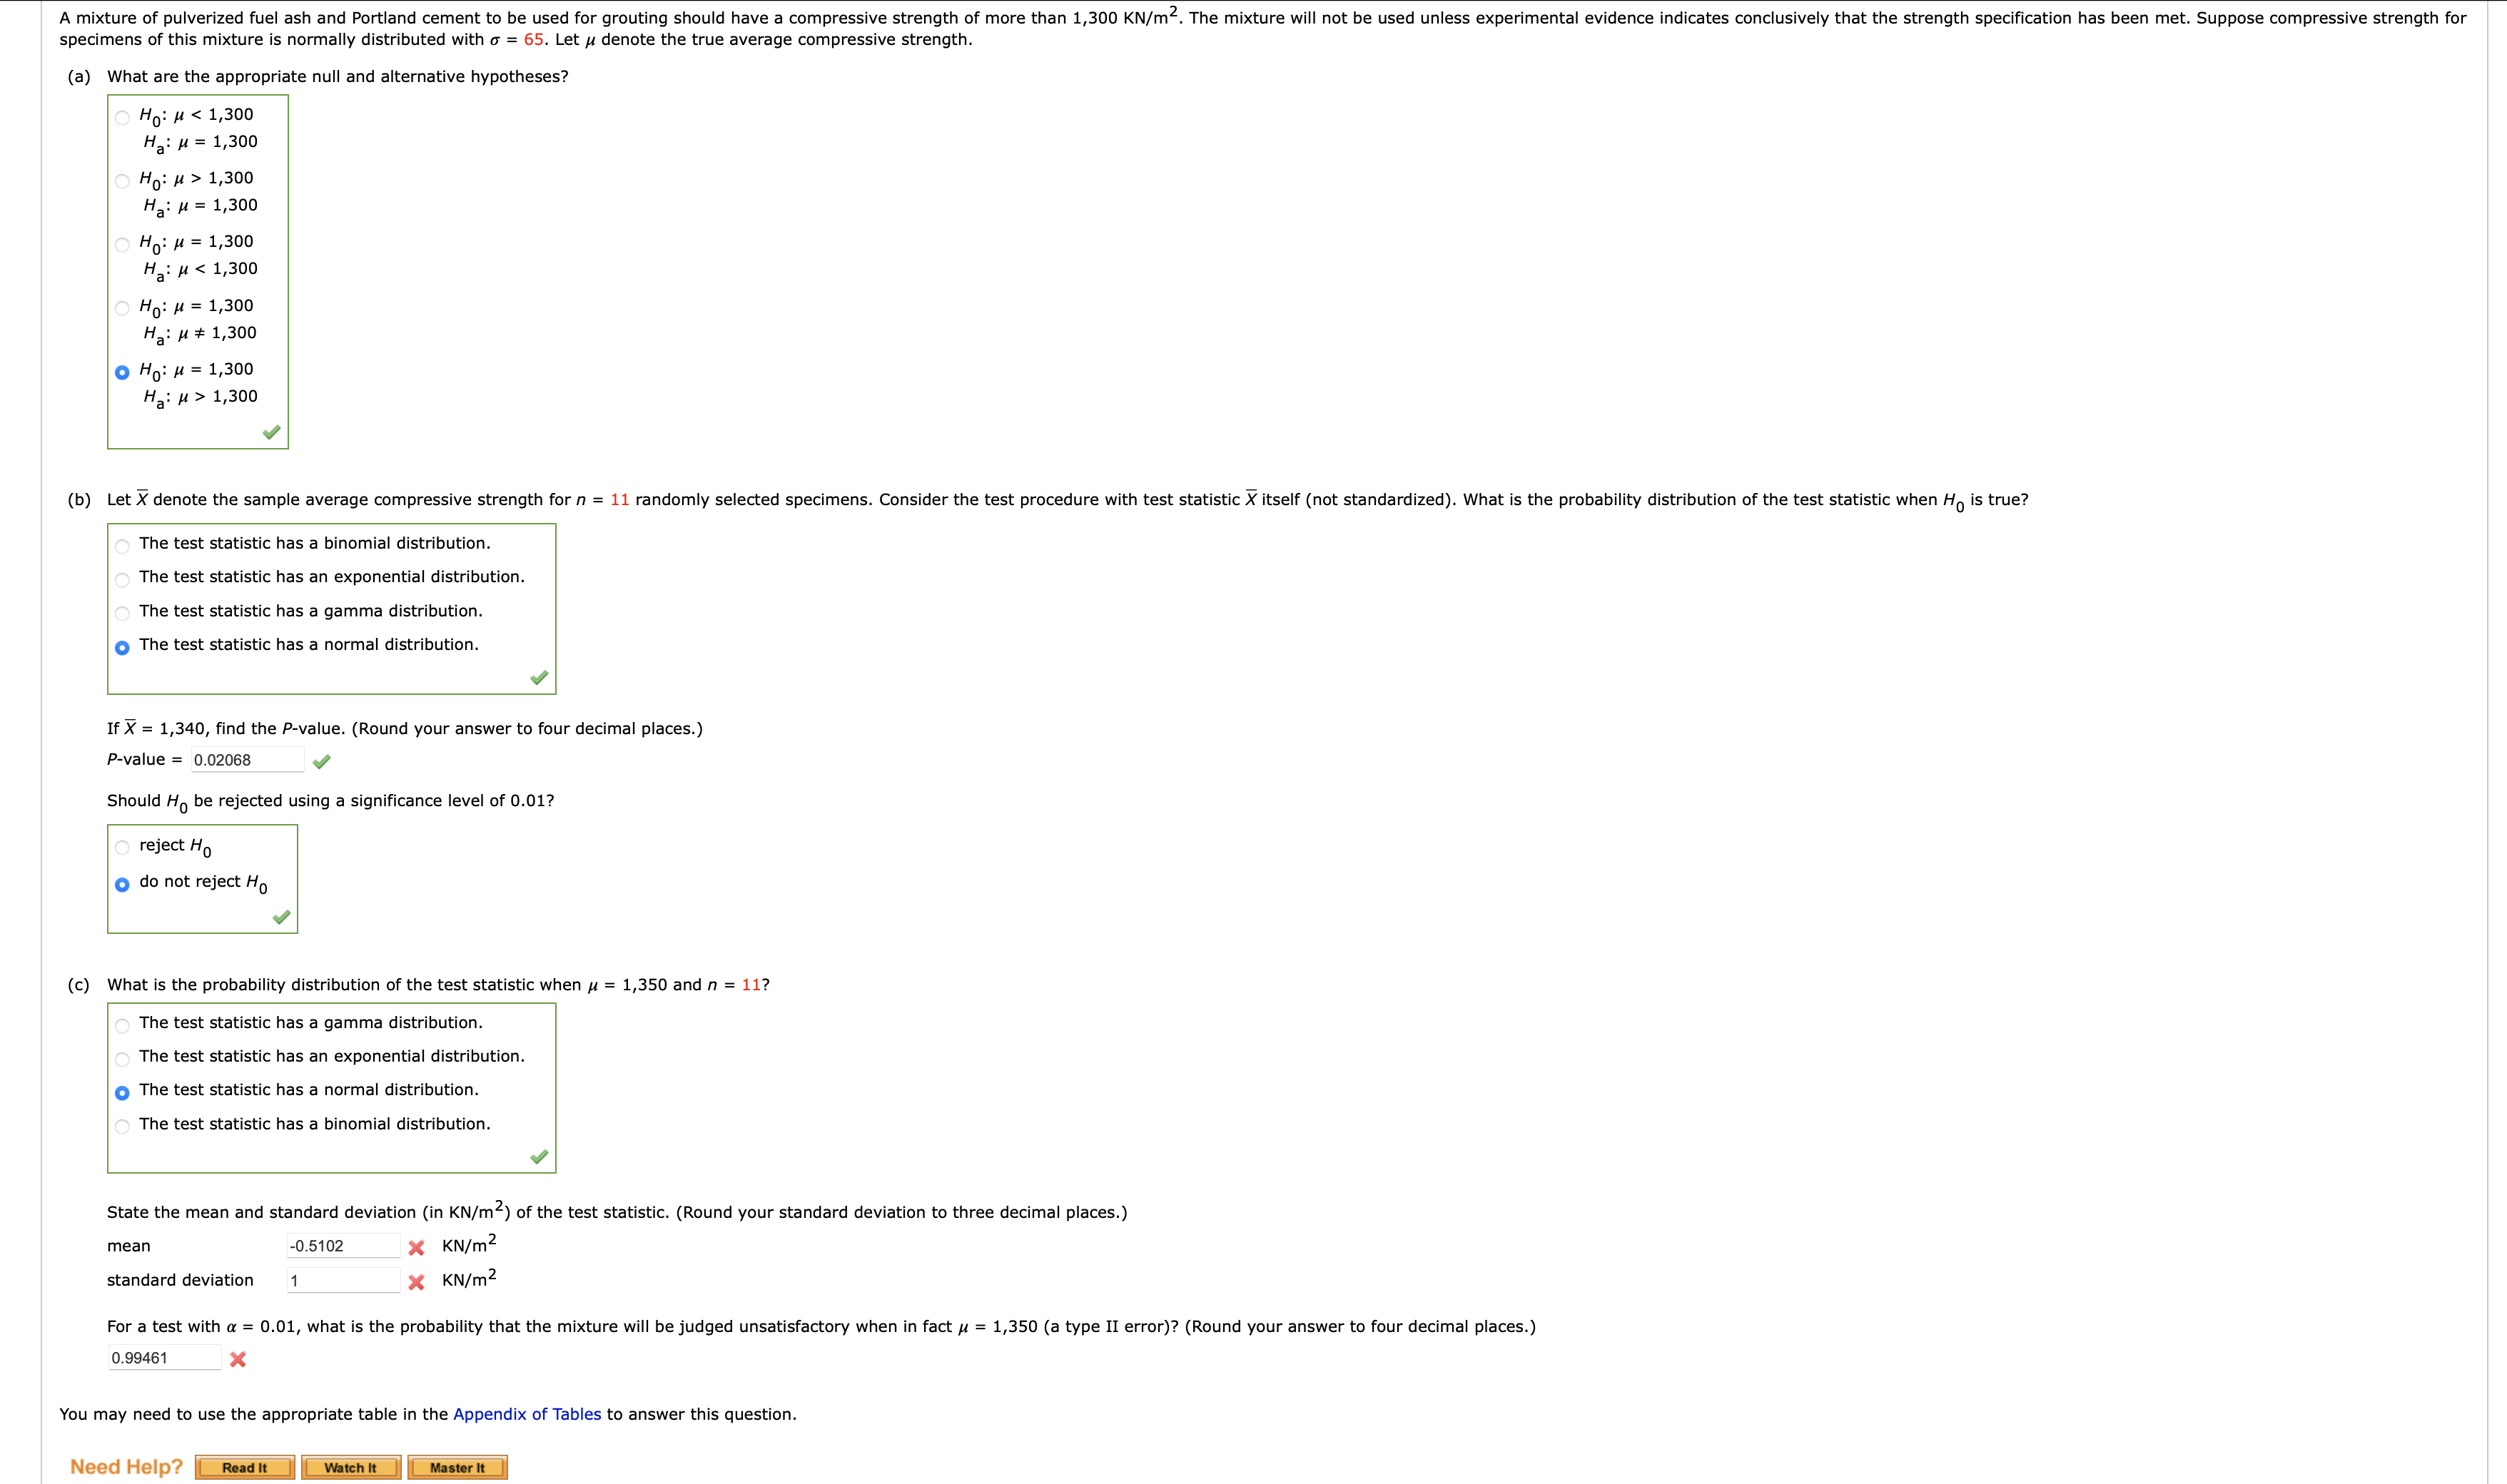
Unlike most packaged food products, alcohol beverage container labels are not required to show calorie or nutrient content. An article reported on a pilot study in which each of 57 individuals in a sample was asked to estimate the calorie content of a 12 oz can of beer known to contain 153 calories. The resulting sample mean estimated calorie level was 192 and the sample standard deviation was 87. Does this data suggest that the true average estimated calorie content in the population sampled exceeds the actual content? Test the appropriate hypotheses at significance level 0.001. State the appropriate null and alternative hypotheses. O Ho: M = 153 Ha: M S 153 O Ho: M = 153 Ha: M 153 Calculate the test statistic and determine the P-value. (Round your test statistic to two decimal places and your P-value to four decimal places.) Z = 3.38 P-value = 0.0000 X State the conclusion in the problem context. Reject the null hypothesis. There is not sufficient evidence that the true average estimated calorie content of this beer exceeds the actual content. O Do not reject the null hypothesis. There is sufficient evidence that the true average estimated calorie content of this beer exceeds the actual content. Reject the null hypothesis. There is sufficient evidence that the true average estimated calorie content of this beer exceeds the actual content. Do not reject the null hypothesis. There is not sufficient evidence that the true average estimated calorie content of this beer exceeds the actual content. You may need to use the appropriate table in the Appendix of Tables to answer this question. Need Help? Read ItA mixture of pulverized fuel ash and Portland cement to be used for grouting should have a compressive strength of more than 1,300 KN/m. The mixture will not be used unless experimental evidence indicates conclusively that the strength specification has been met. Suppose compressive strength for specimens of this mixture is normally distributed with o = 65. Let / denote the true average compressive strength. (a) What are the appropriate null and alternative hypotheses? Ho: M 1,300 Ha: M = 1,300 Ho: M = 1,300 Ha: M 1,300 (b) Let X denote the sample average compressive strength for n = 11 randomly selected specimens. Consider the test procedure with test statistic X itself (not standardized). What is the probability distribution of the test statistic when Ho is true? The test statistic has a binomial distribution. The test statistic has an exponential distribution. The test statistic has a gamma distribution. The test statistic has a normal distribution. If X = 1,340, find the P-value. (Round your answer to four decimal places.) P-value = 0.02068 Should Ho be rejected using a significance level of 0.01? reject Ho do not reject Ho (c) What is the probability distribution of the test statistic when u = 1,350 and n = 11? The test statistic has a gamma distribution. The test statistic has an exponential distribution. The test statistic has a normal distribution. The test statistic has a binomial distribution. State the mean and standard deviation (in KN/m) of the test statistic. (Round your standard deviation to three decimal places.) mean -0.5102 X KN/m standard deviation X KN/m2 For a test with a = 0.01, what is the probability that the mixture will be judged unsatisfactory when in fact u = 1,350 (a type II error)? (Round your answer to four decimal places.) 0.99461 You may need to use the appropriate table in the Appendix of Tables to answer this question. Need Help? Read it Watch It Master It


