

Question
Unable to copy the excel sheet since it gives an error Too long & secondly can't share the google link since it is 3rd party
Unable to copy the excel sheet since it gives an error "Too long" & secondly can't share the google link since it is 3rd party violation.
Please let me know how do I share the excel sheet. Also, please answer the question, will definitely give a thumbs-up.
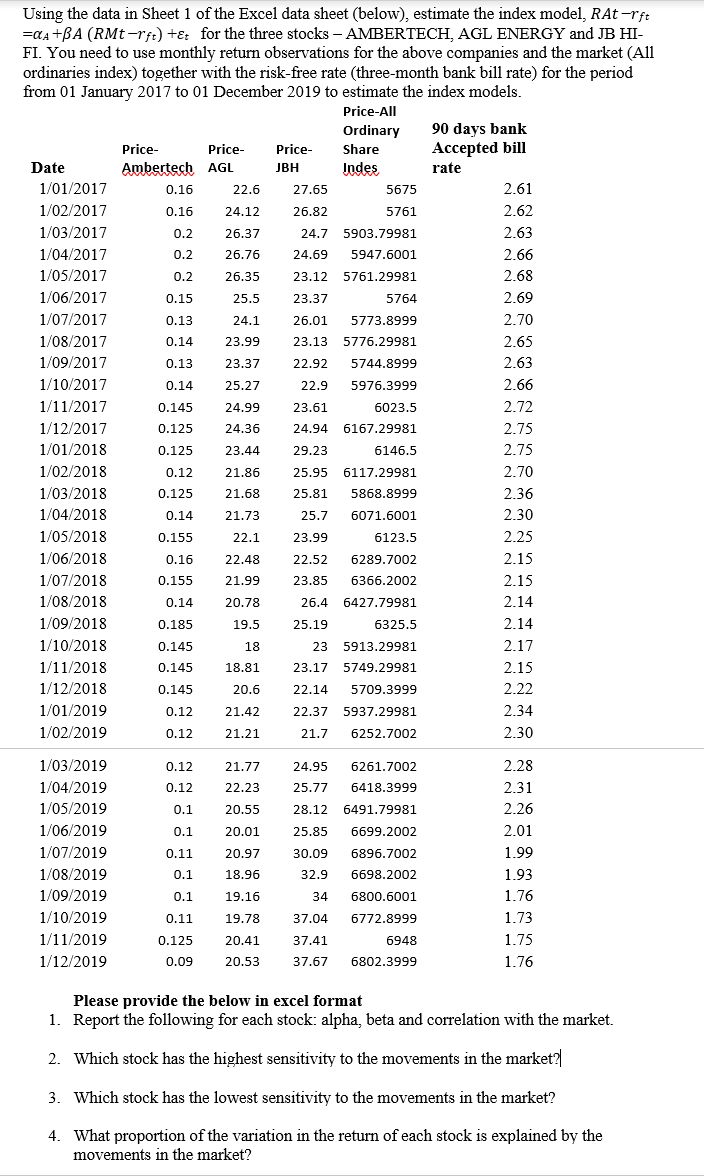
Using the data in Sheet 1 of the Excel data sheet (below), estimate the index model, RA-rft =aA+BA (RMt-rft) +t for the three stocks - AMBERTECH, AGL ENERGY and JB HI- FI. You need to use monthly return observations for the above companies and the market (All ordinaries index) together with the risk-free rate (three-month bank bill rate) for the period from 01 January 2017 to 01 December 2019 to estimate the index models. Price-All Ordinary 90 days bank Price Price Price Share Accepted bill Date Ambertech AGL JBH Indes rate 1/01/2017 0.16 22.6 27.65 5675 2.61 1/02/2017 0.16 24.12 26.82 5761 2.62 1/03/2017 0.2 26.37 24.7 5903.79981 2.63 1/04/2017 0.2 26.76 24.69 5947.6001 2.66 1/05/2017 0.2 26.35 23.12 5761.29981 2.68 1/06/2017 0.15 25.5 23.37 5764 2.69 1/07/2017 0.13 24.1 26.01 5773.8999 2.70 1/08/2017 0.14 23.99 23.13 5776.29981 2.65 1/09/2017 0.13 23.37 22.92 5744.8999 2.63 1/10/2017 0.14 25.27 22.9 5976.3999 2.66 1/11/2017 0.145 24.99 23.61 6023.5 2.72 1/12/2017 0.125 24.36 24.94 6167.29981 2.75 1/01/2018 0.125 23.44 29.23 6146.5 2.75 1/02/2018 0.12 21.86 25.95 6117.29981 2.70 1/03/2018 0.125 21.68 25.81 5868.8999 2.36 1/04/2018 0.14 21.73 25.7 6071.6001 2.30 1/05/2018 0.155 22.1 23.99 6123.5 2.25 1/06/2018 0.16 22.48 22.52 6289.7002 2.15 1/07/2018 0.155 21.99 23.85 6366.2002 2.15 1/08/2018 0.14 20.78 26.4 6427.79981 2.14 1/09/2018 0.185 19.5 25.19 6325.5 2.14 1/10/2018 0.145 18 23 5913.29981 2.17 1/11/2018 0.145 18.81 23.17 5749.29981 2.15 1/12/2018 0.145 20.6 22.14 5709.3999 2.22 1/01/2019 0.12 21.42 22.37 5937.29981 2.34 1/02/2019 0.12 21.21 21.7 6252.7002 2.30 0.12 21.77 6261.7002 24.95 25.77 0.12 22.23 6418.3999 0.1 20.55 28.12 0.1 20.01 25.85 0.11 20.97 30.09 1/03/2019 1/04/2019 1/05/2019 1/06/2019 1/07/2019 1/08/2019 1/09/2019 1/10/2019 1/11/2019 1/12/2019 2.28 2.31 2.26 2.01 1.99 1.93 1.76 1.73 1.75 1.76 0.1 18.96 6491.79981 6699.2002 6896.7002 6698.2002 6800.6001 6772.8999 6948 6802.3999 32.9 0.1 19.16 34 0.11 19.78 37.04 20.41 37.41 0.125 0.09 20.53 37.67 Please provide the below in excel format 1. Report the following for each stock: alpha, beta and correlation with the market. 2. Which stock has the highest sensitivity to the movements in the market? 3. Which stock has the lowest sensitivity to the movements in the market? 4. What proportion of the variation in the return of each stock is explained by the movements in the market? Using the data in Sheet 1 of the Excel data sheet (below), estimate the index model, RA-rft =aA+BA (RMt-rft) +t for the three stocks - AMBERTECH, AGL ENERGY and JB HI- FI. You need to use monthly return observations for the above companies and the market (All ordinaries index) together with the risk-free rate (three-month bank bill rate) for the period from 01 January 2017 to 01 December 2019 to estimate the index models. Price-All Ordinary 90 days bank Price Price Price Share Accepted bill Date Ambertech AGL JBH Indes rate 1/01/2017 0.16 22.6 27.65 5675 2.61 1/02/2017 0.16 24.12 26.82 5761 2.62 1/03/2017 0.2 26.37 24.7 5903.79981 2.63 1/04/2017 0.2 26.76 24.69 5947.6001 2.66 1/05/2017 0.2 26.35 23.12 5761.29981 2.68 1/06/2017 0.15 25.5 23.37 5764 2.69 1/07/2017 0.13 24.1 26.01 5773.8999 2.70 1/08/2017 0.14 23.99 23.13 5776.29981 2.65 1/09/2017 0.13 23.37 22.92 5744.8999 2.63 1/10/2017 0.14 25.27 22.9 5976.3999 2.66 1/11/2017 0.145 24.99 23.61 6023.5 2.72 1/12/2017 0.125 24.36 24.94 6167.29981 2.75 1/01/2018 0.125 23.44 29.23 6146.5 2.75 1/02/2018 0.12 21.86 25.95 6117.29981 2.70 1/03/2018 0.125 21.68 25.81 5868.8999 2.36 1/04/2018 0.14 21.73 25.7 6071.6001 2.30 1/05/2018 0.155 22.1 23.99 6123.5 2.25 1/06/2018 0.16 22.48 22.52 6289.7002 2.15 1/07/2018 0.155 21.99 23.85 6366.2002 2.15 1/08/2018 0.14 20.78 26.4 6427.79981 2.14 1/09/2018 0.185 19.5 25.19 6325.5 2.14 1/10/2018 0.145 18 23 5913.29981 2.17 1/11/2018 0.145 18.81 23.17 5749.29981 2.15 1/12/2018 0.145 20.6 22.14 5709.3999 2.22 1/01/2019 0.12 21.42 22.37 5937.29981 2.34 1/02/2019 0.12 21.21 21.7 6252.7002 2.30 0.12 21.77 6261.7002 24.95 25.77 0.12 22.23 6418.3999 0.1 20.55 28.12 0.1 20.01 25.85 0.11 20.97 30.09 1/03/2019 1/04/2019 1/05/2019 1/06/2019 1/07/2019 1/08/2019 1/09/2019 1/10/2019 1/11/2019 1/12/2019 2.28 2.31 2.26 2.01 1.99 1.93 1.76 1.73 1.75 1.76 0.1 18.96 6491.79981 6699.2002 6896.7002 6698.2002 6800.6001 6772.8999 6948 6802.3999 32.9 0.1 19.16 34 0.11 19.78 37.04 20.41 37.41 0.125 0.09 20.53 37.67 Please provide the below in excel format 1. Report the following for each stock: alpha, beta and correlation with the market. 2. Which stock has the highest sensitivity to the movements in the market? 3. Which stock has the lowest sensitivity to the movements in the market? 4. What proportion of the variation in the return of each stock is explained by the movements in the marketStep by Step Solution
There are 3 Steps involved in it
Step: 1

Get Instant Access to Expert-Tailored Solutions
See step-by-step solutions with expert insights and AI powered tools for academic success
Step: 2

Step: 3
Ace Your Homework with AI
Get the answers you need in no time with our AI-driven, step-by-step assistance
Get Started
M: Finance
Authors: Marcia Cornett, Troy Adair, John Nofsinger
5th Edition
1260772357, 9781260772357