United States Population Objectives: o Explore real data sets of population growth o Construct a mathematical model for predicting the population growth o Understand how
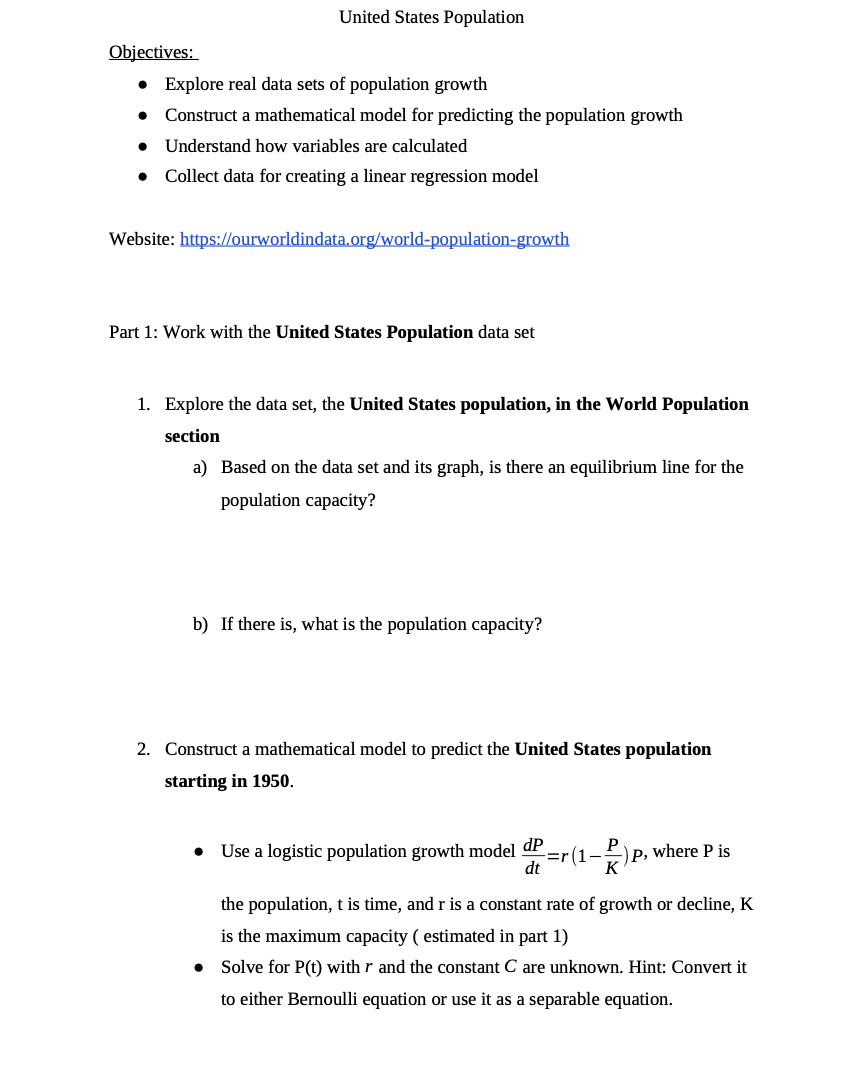
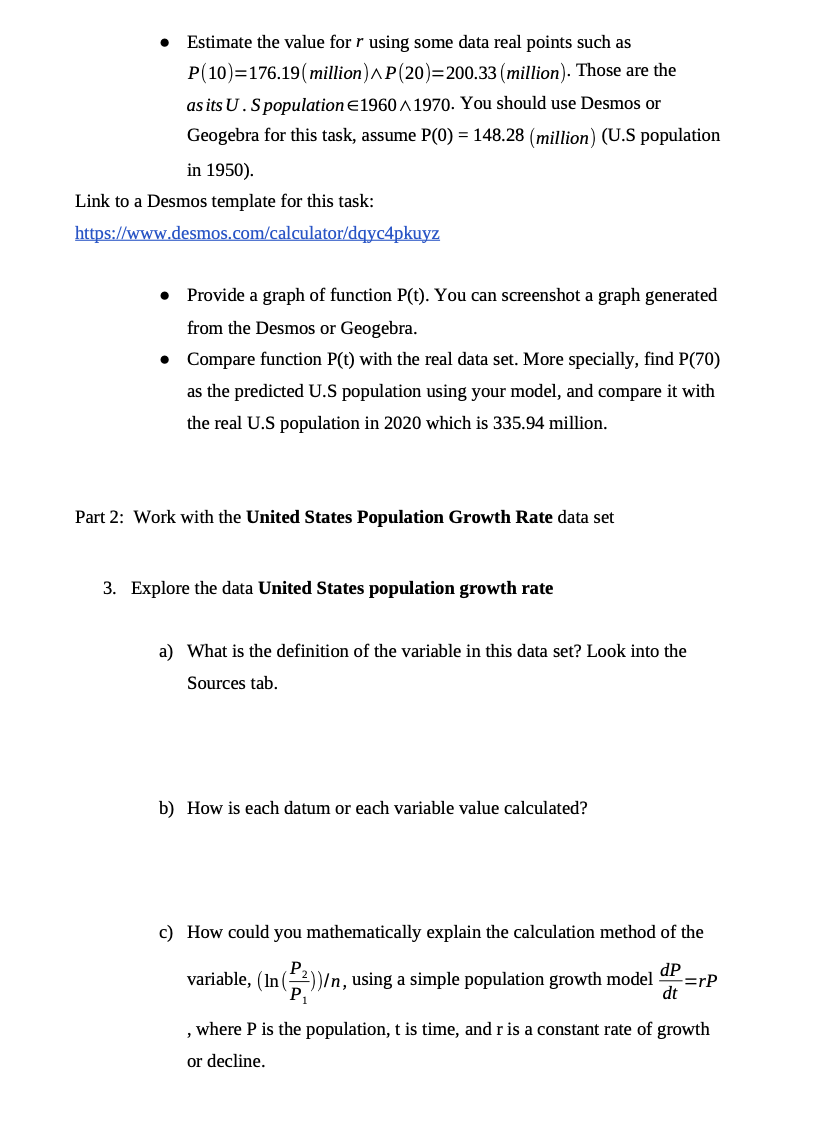
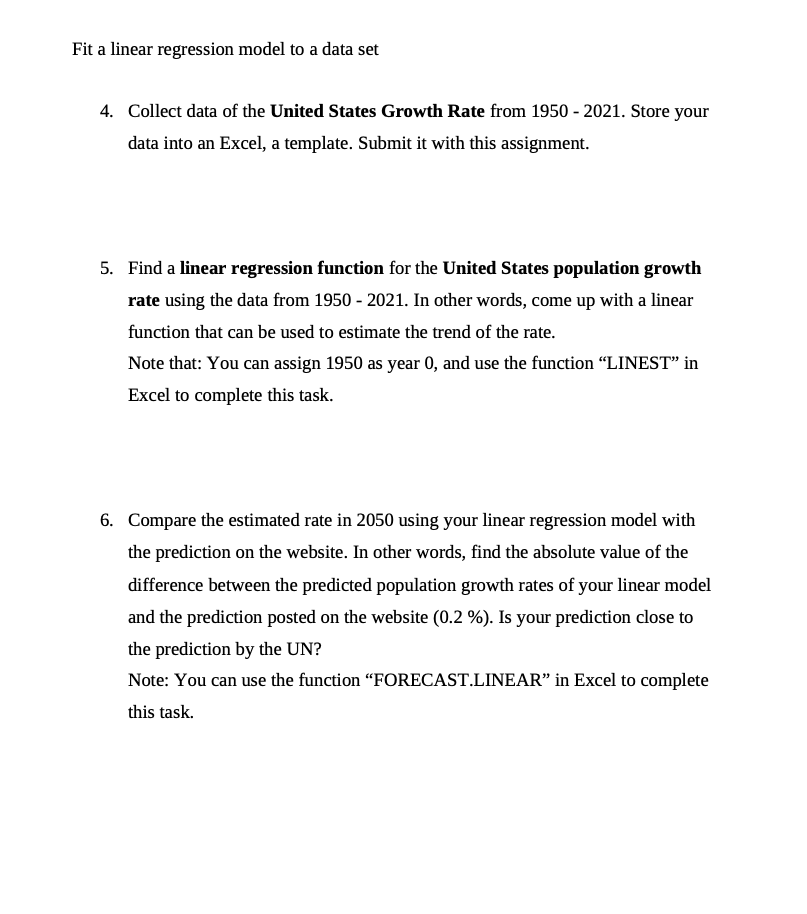
United States Population Objectives: o Explore real data sets of population growth o Construct a mathematical model for predicting the population growth o Understand how variables are calculated . Collect data for creating a linear regression model Website: hitps://ourworldindata.org/world-population-growth Part 1: Work with the United States Population data set 1. Explore the data set, the United States population, in the World Population section a) Based on the data set and its graph, is there an equilibrium line for the population capacity? b) If there is, what is the population capacity? 2. Construct a mathematical model to predict the United States population starting in 1950. o Use a logistic population growth model dp =r(1- B} p where P is dt K the population, t is time, and r is a constant rate of growth or decline, K is the maximum capacity ( estimated in part 1) Solve for P(t) with r and the constant C are unknown. Hint: Convert it to either Bernoulli equation or use it as a separable equation. o [Estimate the value for r using some data real points such as P(10)=176.19(million) A P(20)=200.33 (million)- Those are the asits U . S population 1960 A 1970. Y ou should use Desmos or Geogebra for this task, assume P(0) = 148.28 (million) (U.S population in 1950). Link to a Desmos template for this task: https://www.desmos.com/calculator/dqyc4pkuyz DProvide a graph of function P(t). You can screenshot a graph generated from the Desmos or Geogebra. o Compare function P(t) with the real data set. More specially, find P(70) as the predicted U.S population using your model, and compare it with the real U.S population in 2020 which is 335.94 million. Part 2: Work with the United States Population Growth Rate data set 3. Explore the data United States population growth rate a) What is the definition of the variable in this data set? Look into the Sources tab. b) How is each datum or each variable value calculated? c) How could you mathematically explain the calculation method of the : P, ; ; > dP variable, (ln(P))in, using a simple population growth model E:,P 1 , where P is the population, t is time, and r is a constant rate of growth or decline. Fit a linear regression model to a data set 4. Collect data of the United States Growth Rate from 1950 - 2021. Store your data into an Excel, a template. Submit it with this assignment. 5. Find a linear regression function for the United States population growth rate using the data from 1950 - 2021. In other words, come up with a linear function that can be used to estimate the trend of the rate. Note that: You can assign 1950 as year 0, and use the function \"LINEST\" in Excel to complete this task. 6. Compare the estimated rate in 2050 using your linear regression model with the prediction on the website. In other words, find the absolute value of the difference between the predicted population growth rates of your linear model and the prediction posted on the website (0.2 %). Is your prediction close to the prediction by the UN? Note: You can use the function \"FORECAST.LINEAR\" in Excel to complete this task
Step by Step Solution
There are 3 Steps involved in it
Step: 1
Get Instant Access to Expert-Tailored Solutions
See step-by-step solutions with expert insights and AI powered tools for academic success
Step: 2
Step: 3
Ace Your Homework with AI
Get the answers you need in no time with our AI-driven, step-by-step assistance