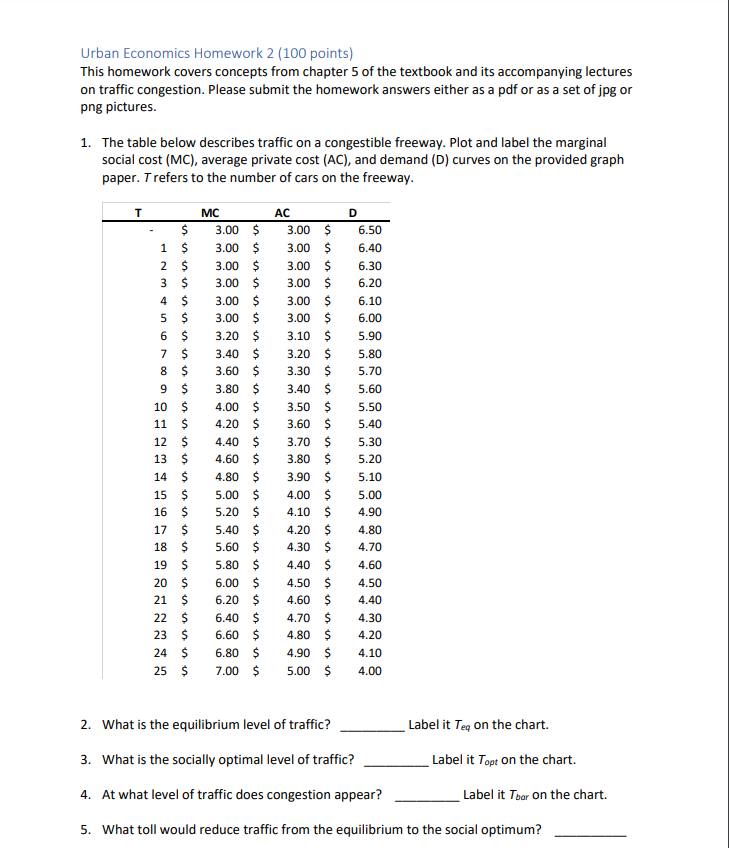
Urban Economics Homework 2 (100 points) This homework covers concepts from chapter 5 of the textbook and its accompanying lectures on traffic congestion. Please submit the homework answers either as a pdf or as a set of jpg or png pictures. 1. The table below describes traffic on a congestible freeway. Plot and label the marginal social cost (MC), average private cost (AC), and demand (D) curves on the provided graph paper. T refers to the number of cars on the freeway. T $ 1 $ 2 $ 3 $ 4 $ 5 $ 6 $ 7 $ 8 S 9 $ 10 $ 11 $ 12 $ 13 $ 14 $ 15 $ 16 $ 17 $ 18 $ 19 $ 20 $ 21 $ 22 $ 23 $ 24 $ 25 $ MC 3.00 $ 3.00 $ 3.00 $ 3.00 $ 3.00 $ 3.00 $ 3.20 $ 3.40 $ 3.60 $ 3.80 $ 4.00 $ 4.20 $ 4.40 $ 4.60 $ 4.80 $ 5.00 $ 5.20 $ 5.40 $ 5.60 $ 5.80 $ 6.00 $ 6.20 $ 6.40 $ 6.60 $ 6.80 $ 7.00 $ AC 3.00 $ 3.00 $ 3.00 $ 3.00 $ 3.00 $ 3.00 $ 3.10 $ 3.20 $ 3.30 $ 3.40 $ 3.50 $ 3.60 $ 3.70 $ 3.80 $ 3.90 $ 4.00 $ 4.10 $ 4.20 $ 4.30 $ 4.40 $ 4.50 $ 4.60 $ 4.70 $ 4.80 $ 4.90 $ 5.00 $ D 6.50 6.40 6.30 6.20 6.10 6.00 5.90 5.80 5.70 5.60 5.50 5.40 5.30 5.20 5.10 5.00 4.90 4.80 4.70 4.60 4.50 4.40 4.30 4.20 4.10 4.00 2. What is the equilibrium level of traffic? Label it Teg on the chart. 3. What is the socially optimal level of traffic? Label it Topt on the chart. 4. At what level of traffic does congestion appear? Label it Tbar on the chart. 5. What toll would reduce traffic from the equilibrium to the social optimum? 0526 5725 $7.00 96.75 $650 SZ 95 $6.00 SZOS $550 $S25 005 SENS $150 $425 SUDO SZES $350 STES $100 $2.75 0525 $225 $2.00 STS OSTS ST16 $100 SZOS OS 05 STOS 0 2 E 4 un 5 9 2 B 10 6 TT ZT 14 ET ST 90 21 81 61 21 22 EZ Traffic (T) Urban Economics Homework 2 (100 points) This homework covers concepts from chapter 5 of the textbook and its accompanying lectures on traffic congestion. Please submit the homework answers either as a pdf or as a set of jpg or png pictures. 1. The table below describes traffic on a congestible freeway. Plot and label the marginal social cost (MC), average private cost (AC), and demand (D) curves on the provided graph paper. T refers to the number of cars on the freeway. T $ 1 $ 2 $ 3 $ 4 $ 5 $ 6 $ 7 $ 8 S 9 $ 10 $ 11 $ 12 $ 13 $ 14 $ 15 $ 16 $ 17 $ 18 $ 19 $ 20 $ 21 $ 22 $ 23 $ 24 $ 25 $ MC 3.00 $ 3.00 $ 3.00 $ 3.00 $ 3.00 $ 3.00 $ 3.20 $ 3.40 $ 3.60 $ 3.80 $ 4.00 $ 4.20 $ 4.40 $ 4.60 $ 4.80 $ 5.00 $ 5.20 $ 5.40 $ 5.60 $ 5.80 $ 6.00 $ 6.20 $ 6.40 $ 6.60 $ 6.80 $ 7.00 $ AC 3.00 $ 3.00 $ 3.00 $ 3.00 $ 3.00 $ 3.00 $ 3.10 $ 3.20 $ 3.30 $ 3.40 $ 3.50 $ 3.60 $ 3.70 $ 3.80 $ 3.90 $ 4.00 $ 4.10 $ 4.20 $ 4.30 $ 4.40 $ 4.50 $ 4.60 $ 4.70 $ 4.80 $ 4.90 $ 5.00 $ D 6.50 6.40 6.30 6.20 6.10 6.00 5.90 5.80 5.70 5.60 5.50 5.40 5.30 5.20 5.10 5.00 4.90 4.80 4.70 4.60 4.50 4.40 4.30 4.20 4.10 4.00 2. What is the equilibrium level of traffic? Label it Teg on the chart. 3. What is the socially optimal level of traffic? Label it Topt on the chart. 4. At what level of traffic does congestion appear? Label it Tbar on the chart. 5. What toll would reduce traffic from the equilibrium to the social optimum? 0526 5725 $7.00 96.75 $650 SZ 95 $6.00 SZOS $550 $S25 005 SENS $150 $425 SUDO SZES $350 STES $100 $2.75 0525 $225 $2.00 STS OSTS ST16 $100 SZOS OS 05 STOS 0 2 E 4 un 5 9 2 B 10 6 TT ZT 14 ET ST 90 21 81 61 21 22 EZ Traffic (T)