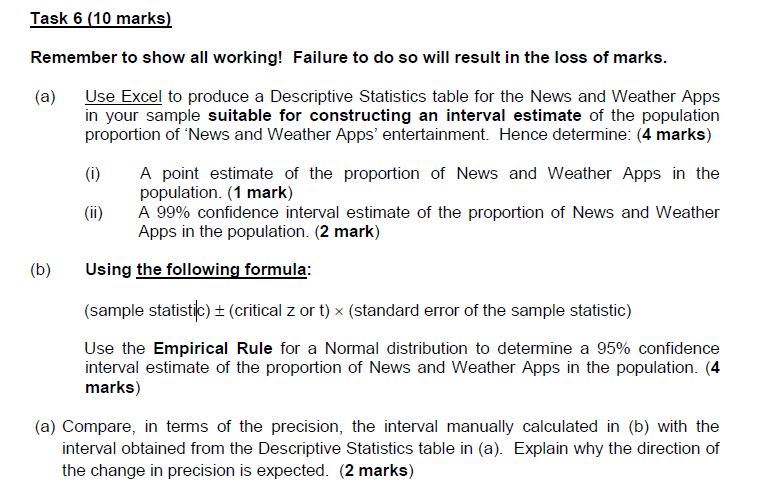
URGENT HELP NEEDED - The Required Data set is in the attached excel and the Question is in the attached image file
Variable descriptions: Column A (PN): Contains the unique identification number from 001 to 150 for participants V1= Income: Annual Income of the smart phone user in dollars ($) V2= Gender: Gender of the smart phone user (Male=2, Female=1) V3= Age: Age of the smart phone user V4= State where the smart phone user resides (NSW=1, QLD=2, TAS=8, NT=6, SA=5, ACT=7, WA=4, VIC=3) V5= Monthly Bill= The amount spent last month on the smart phone in dollars ($) V6= Percent for work= The percentage use of smart phone for work in percentage V7= Calls= The number of calls made last month V8= Online Purchase= Used the smart phone to purchase an item online? (YES=1, NO=0) V9= Entertainment type= Most frequent downloaded entertainment type (Music, Video and Movies=1; News and Weather Apps=2; IM and Social Network Apps=3; Games=4; eBooks=5; Maps and Navigation Apps=6 ; Other=7) V10= Satisfaction with provider= The level of satisfaction with the smart phone service provider (Very dissatisfied=1; Little dissatisfied=2; Moterately satisfied=3; Very satisfied=4 CN 260 220 37 164 135 228 187 266 14 195 158 174 23 177 254 241 141 64 99 111 138 231 243 189 184 136 283 267 264 250 230 212 265 210 223 171 38 297 246 199 118 270 120 137 257 109 233 $ $ $ $ $ $ $ $ $ $ $ $ $ $ $ $ $ $ $ $ $ $ $ $ $ $ $ $ $ $ $ $ $ $ $ $ $ $ $ $ $ $ $ $ $ $ $ V1 96,210 95,570 99,374 98,678 58,000 97,864 70,000 99,993 48,652 70,000 180,000 165,000 99,082 165,000 95,297 98,678 98,673 101,262 101,095 79,000 102,770 156,225 100,200 98,678 45,000 96,691 99,993 99,374 101,262 98,191 103,265 68,900 97,338 100,361 99,398 98,673 98,364 45,000 95,297 95,297 95,818 45,000 97,176 100,267 99,398 145,000 99,398 V2 1 1 1 1 1 2 1 2 1 1 2 1 2 1 1 1 1 1 2 2 2 2 2 1 2 1 2 1 1 2 1 2 2 2 1 1 1 2 1 1 1 2 2 1 1 2 1 V3 55 52 39 26 34 52 43 33 39 43 51 39 34 39 49 26 53 25 39 20 33 44 35 26 34 40 33 39 25 33 53 18 35 26 35 53 59 34 49 49 41 34 44 49 35 61 35 V4 2 4 5 2 3 4 1 5 5 1 5 4 6 4 1 2 5 3 1 3 1 2 3 2 5 2 5 5 3 1 1 1 3 4 1 5 4 5 1 1 2 5 5 1 1 1 1 V5 $ $ $ $ $ $ $ $ $ $ $ $ $ $ $ $ $ $ $ $ $ $ $ $ $ $ $ $ $ $ $ $ $ $ $ $ $ $ $ $ $ $ $ $ $ $ $ 30 38 117 70 113 86 124 74 61 124 61 55 86 55 59 70 30 99 20 110 77 71 85 70 37 20 74 117 99 66 78 72 50 11 54 30 64 37 59 59 16 37 41 71 54 44 54 V6 5% 50% 5% 0% 10% 10% 0% 5% 0% 0% 50% 15% 5% 15% 50% 0% 5% 20% 35% 0% 35% 15% 35% 0% 0% 5% 5% 5% 20% 15% 35% 0% 20% 10% 15% 5% 35% 0% 50% 50% 5% 0% 5% 35% 15% 60% 15% V7 20 13 68 41 45 57 9 35 42 9 19 3 28 3 17 41 29 44 2 46 16 12 18 41 14 21 35 68 44 23 39 19 26 5 11 29 24 14 17 17 9 14 3 17 11 5 11 V8 1 0 0 1 0 0 0 0 0 0 1 1 1 1 1 1 0 1 1 1 1 1 1 1 0 0 0 0 1 1 0 0 1 1 1 0 0 0 1 1 1 0 1 0 1 0 1 234 10 185 $ $ $ 45,000 97,930 96,286 2 1 1 34 42 34 5 3 1 $ $ $ 37 98 95 0% 20% 15% 14 46 2 0 1 0 V9 3 5 4 4 2 1 1 4 1 1 3 3 4 3 5 4 5 4 7 1 3 1 5 4 5 3 4 4 4 1 2 1 1 2 1 5 4 5 5 5 5 5 3 3 1 4 1 V10 2 3 4 3 4 3 3 2 2 3 3 4 4 4 3 3 4 4 4 3 3 4 4 3 4 3 2 4 4 4 4 4 4 3 1 4 2 4 3 3 3 4 4 4 1 3 1 5 4 1 4 1 4 V9 3 5 4 4 2 1 1 4 1 1 3 3 4 3 5 4 5 4 7 1 3 1 5 4 5 3 4 4 4 1 2 1 1 2 1 5 4 5 5 5 5 5 3 3 1 4 1 Entertainment Type Music, Video & Movies News & Weather Apps IM & Social Networking Apps Games eBooks Maps & Nagivation Apps Other Frequency Relative Frequency 13 26% 3 6% 8 16% 13 26% 12 24% 0 0% 1 2% 5 4 1 Sample population by Entertainment Type 14 13 13 12 12 10 8 8 6 4 3 2 1 0 0 Sample Proportion by Entertainment Type 2% 24% 26% 6% 26% Music, Video & Movies Games Other 16% News & Weather Apps eBooks IM & Social Networking Apps Maps & Nagivation Apps $ $ $ $ $ $ $ $ $ $ $ $ $ $ $ $ $ $ $ $ $ $ $ $ $ $ $ $ $ $ $ $ $ $ $ $ $ $ $ $ $ $ $ $ $ $ $ l 45,000 45,000 45,000 45,000 48,652 58,000 68,900 70,000 70,000 79,000 95,297 95,297 95,297 95,570 95,818 96,210 96,286 96,691 97,176 97,338 97,864 97,930 98,191 98,364 98,673 98,673 98,678 98,678 98,678 99,082 99,374 99,374 99,398 99,398 99,398 99,993 99,993 100,200 100,267 100,361 101,095 101,262 101,262 102,770 103,265 145,000 156,225 Descriptive Statistics - Income Mean 96779.56 Standard Error 4011.88984956 Median 98673 Mode 45000 Standard Deviation 28368.34518 Sample Variance 804763008.251 Kurtosis 2.0535905751 Skewness 0.6926202222 Range 135000 Minimum 45000 Maximum 180000 Sum 4838978 Count 50 Largest(1) 180000 Smallest(1) 45000 Confidence Level(95.0%) 8062.19449577 $ 165,000 $ 165,000 $ 180,000 98673 95297.000 100216.75 4919.750 $ $ 98,673 0.933193 0.066807 0.866386 87,917.38 \f