Question: urgent help please here is my question QUESTION Explanation Page The following table contains the first exam score and the second exam score for a
urgent help please
here is my question
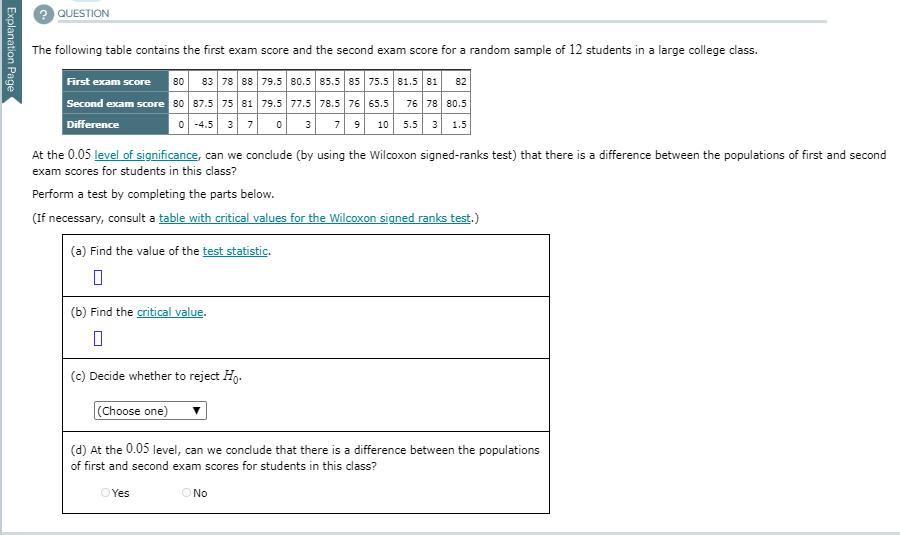
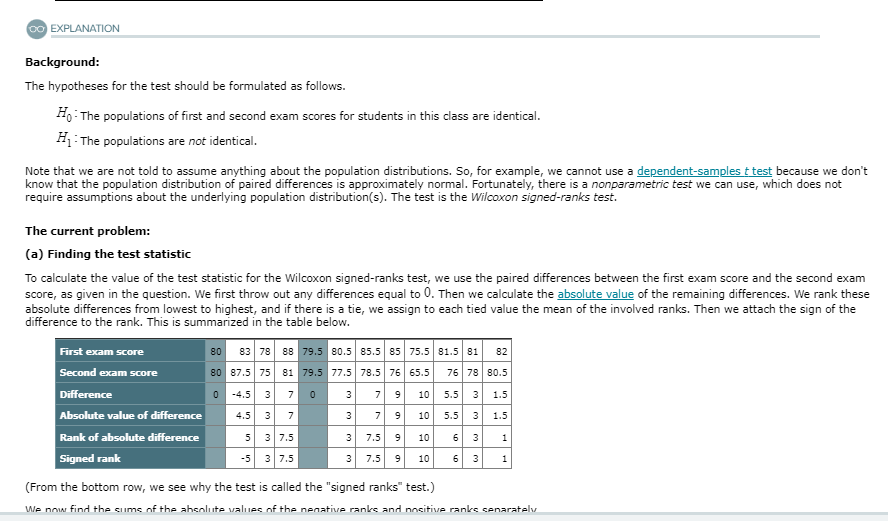
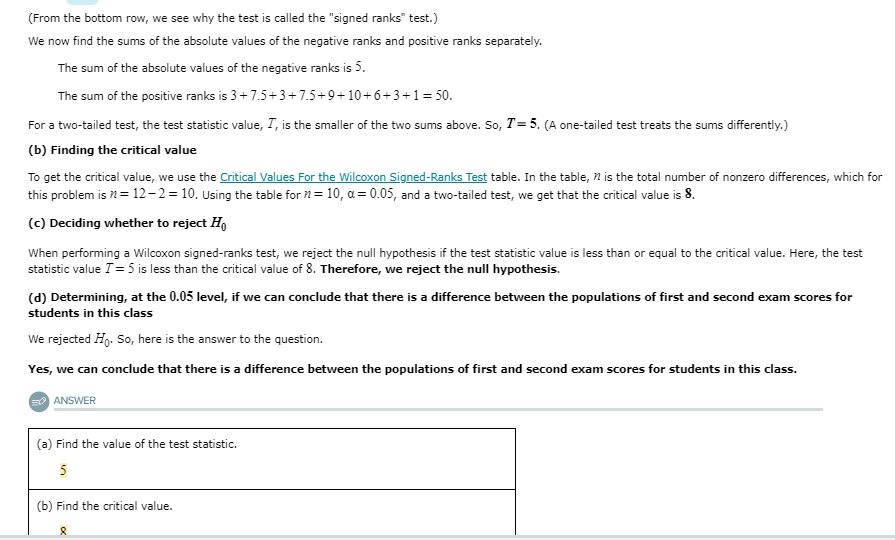
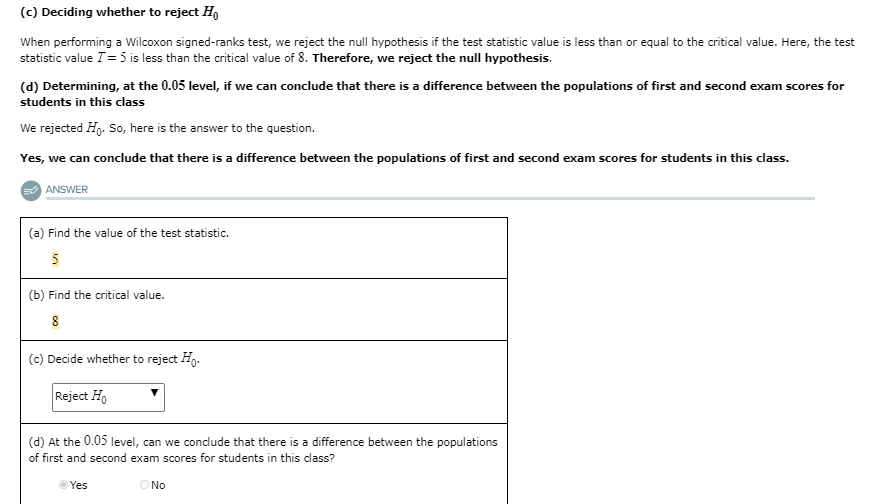
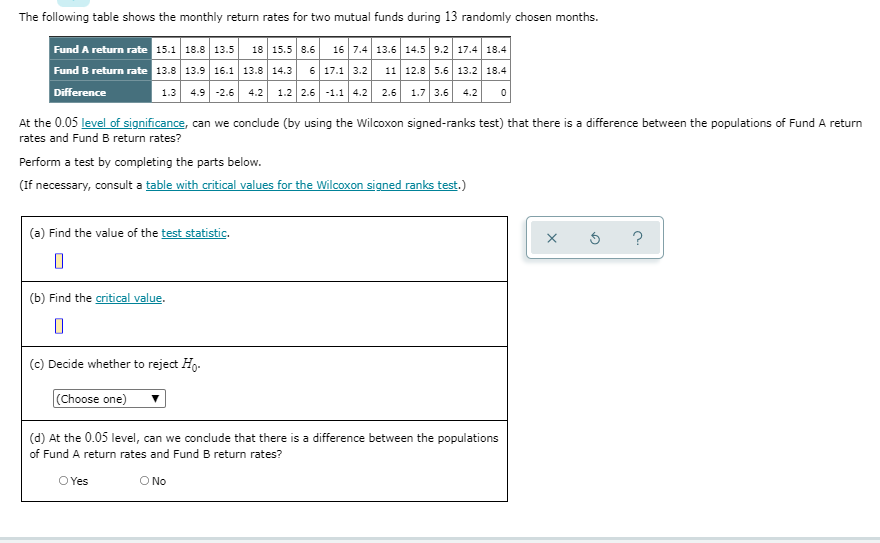
QUESTION Explanation Page The following table contains the first exam score and the second exam score for a random sample of 12 students in a large college class. First exam score 80 83 88 79.5 80.5 85.5 85 75.5 81.5 81 82 Second exam score 80 87.5 75 81 79.5 77.5 78.5 76 65.5 76 78 80.5 Difference 0 -4.5 3 7 0 3 9 10 5.5 3 1.5 At the 0.05 level of significance, can we conclude (by using the Wilcoxon signed-ranks test) that there is a difference between the populations of first and second exam scores for students in this class? Perform a test by completing the parts below. (If necessary, consult a table with critical values for the Wilcoxon signed ranks test.) (a) Find the value of the test statistic. (b) Find the critical value. 0 (c) Decide whether to reject Ho. (Choose one) (d) At the 0.05 level, can we conclude that there is a difference between the populations of first and second exam scores for students in this class? OYes ONoDO EXPLANATION Background: The hypotheses for the test should be formulated as follows. Ho: The populations of first and second exam scores for students in this class are identical. H1 : The populations are not identical. Note that we are not told to assume anything about the population distributions. So, for example, we cannot use a dependent-samples & test because we don't know that the population distribution of paired differences is approximately normal. Fortunately, there is a nonparametric test we can use, which does not require assumptions about the underlying population distribution(s). The test is the Wilcoxon signed-ranks test. The current problem: (a) Finding the test statistic To calculate the value of the test statistic for the Wilcoxon signed-ranks test, we use the paired differences between the first exam score and the second exam score, as given in the question. We first throw out any differences equal to 0. Then we calculate the absolute value of the remaining differences. We rank these absolute differences from lowest to highest, and if there is a tie, we assign to each tied value the mean of the involved ranks. Then we attach the sign of the difference to the rank. This is summarized in the table below. First exam score 80 83 78 88 79.5 80.5 85.5 85 |75.5 81.5 81 82 Second exam score 80 87.5 75 79.5 77.5 78.5 76 65.5 76 78 80.5 Difference 5 5 Absolute value of difference 4.5 7 Rank of absolute difference 3 7.5 Signed rank 3 7.5 7.5 6 1 (From the bottom row, we see why the test is called the "signed ranks" test.) We now find the cume of the absolute values of the nenative ranks and nocitive ranks separately(From the bottom row, we see why the test is called the "signed ranks" test.) We now find the sums of the absolute values of the negative ranks and positive ranks separately. The sum of the absolute values of the negative ranks is 5. The sum of the positive ranks is 3+ 7.5+3+7.5+9+ 10+6+3+1 =50. For a two-tailed test, the test statistic value, ", is the smaller of the two sums above. So, 7"= 5. (A one-tailed test treats the sums differently.) (b) Finding the critical value To get the critical value, we use the Critical Values For the Wilcoxon Signed-Ranks Test table. In the table, 72 is the total number of nonzero differences, which for this problem is " = 12-2 = 10. Using the table for " = 10, a=0.05, and a two-tailed test, we get that the critical value is 8. (c) Deciding whether to reject Ho When performing a Wilcoxon signed-ranks test, we reject the null hypothesis if the test statistic value is less than or equal to the critical value. Here, the test statistic value 7 = 3 is less than the critical value of 8. Therefore, we reject the null hypothesis. (d) Determining, at the 0.05 level, if we can conclude that there is a difference between the populations of first and second exam scores for students in this class We rejected Ho. So, here is the answer to the question. Yes, we can conclude that there is a difference between the populations of first and second exam scores for students in this class. ANSWER (a) Find the value of the test statistic. (b) Find the critical value.(c) Deciding whether to reject Ho When performing a Wilcoxon signed-ranks test, we reject the null hypothesis if the test statistic value is less than or equal to the critical value. Here, the test statistic value 7 = 5 is less than the critical value of 8. Therefore, we reject the null hypothesis. (d) Determining, at the 0.05 level, if we can conclude that there is a difference between the populations of first and second exam scores for students in this class We rejected H10. So, here is the answer to the question. Yes, we can conclude that there is a difference between the populations of first and second exam scores for students in this class. ANSWER (a) Find the value of the test statistic. (b) Find the critical value. (c) Decide whether to reject Fo. Reject Ho (d) At the 0.05 level, can we conclude that there is a difference between the populations of first and second exam scores for students in this class? O Yes ONoThe following table shows the monthly return rates for two mutual funds during 13 randomly chosen months. Fund A return rate 15.1 18.8 13.5 15.5 8.6 16 7.4 13.6 14.5 9.2 17.4 18.4 Fund B return rate 13.8 13.9 16.1 13.8 14.3 6 17.1 3.2 11 12.8 5.6 13.2 18.4 Difference 1.3 4.9 -2.6 4.2 1.2 2.6 -1.1 4.2 2.6 1.7 3.6 4.2 0 At the 0.05 level of significance, can we conclude (by using the Wilcoxon signed-ranks test) that there is a difference between the populations of Fund A return rates and Fund B return rates? Perform a test by completing the parts below. (If necessary, consult a table with critical values for the Wilcoxon signed ranks test.) (a) Find the value of the test statistic. X 5 (b) Find the critical value. (c) Decide whether to reject Ho- (Choose one) (d) At the 0.05 level, can we conclude that there is a difference between the populations of Fund A return rates and Fund B return rates? O Yes O No
Step by Step Solution
There are 3 Steps involved in it

Get step-by-step solutions from verified subject matter experts


