

Answered step by step
Verified Expert Solution
Question
1 Approved Answer
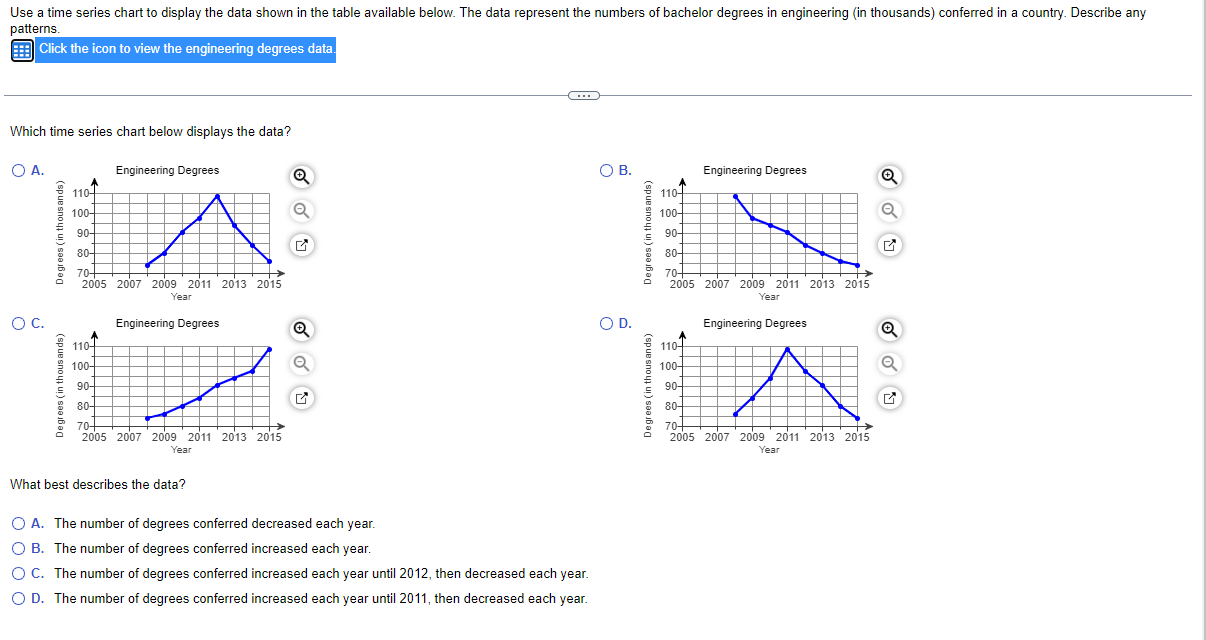
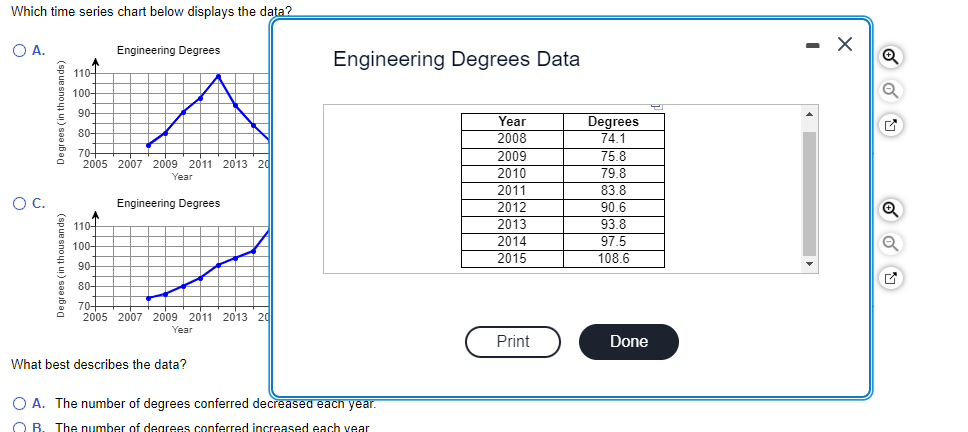
Use a time series chart to display the data shown in the table available below. The data represent the numbers of bachelor degrees in engineering
Step by Step Solution
There are 3 Steps involved in it
Step: 1

Get Instant Access to Expert-Tailored Solutions
See step-by-step solutions with expert insights and AI powered tools for academic success
Step: 2

Step: 3
Ace Your Homework with AI
Get the answers you need in no time with our AI-driven, step-by-step assistance
Get Started
Trigonometry
Authors: Mark Dugopolski
3rd Edition
0321899830, 9780321899835